
Solana Shows Early Signs of Recovery: The ‘W’ Pattern Emerges
Solana is generating excitement among investors as it reveals early signs of a potential recovery, indicated by the formation of a classic “W” pattern on its 12-hour chart. This bullish structure has materialized following a sharp decline in November, and should a confirmed breakout occur, it could propel SOL into a significant upward movement.
Solana Holders Provide Support
Recent data from the HODLer Net Position Change suggests that long-term holders (LTHs) are beginning to ease off their selling pressure. The decreasing outflows signal a reduction in distribution and a gradual shift towards a more neutral market stance. This trend is encouraging for Solana, as LTHs play a crucial role in stabilizing price movements. Their hesitant approach to selling allows for the potential buildup of recovery momentum.
The improving sentiment among LTHs indicates that confidence in the market could soon return. As the selling pressure from these influential holders diminishes, the likelihood of inflows rises. Historically, transitions from heavy outflows to balanced movements have often led to significant mid-term price rebounds for SOL.
Solana HODLer Net Position Change. Source: Glassnode
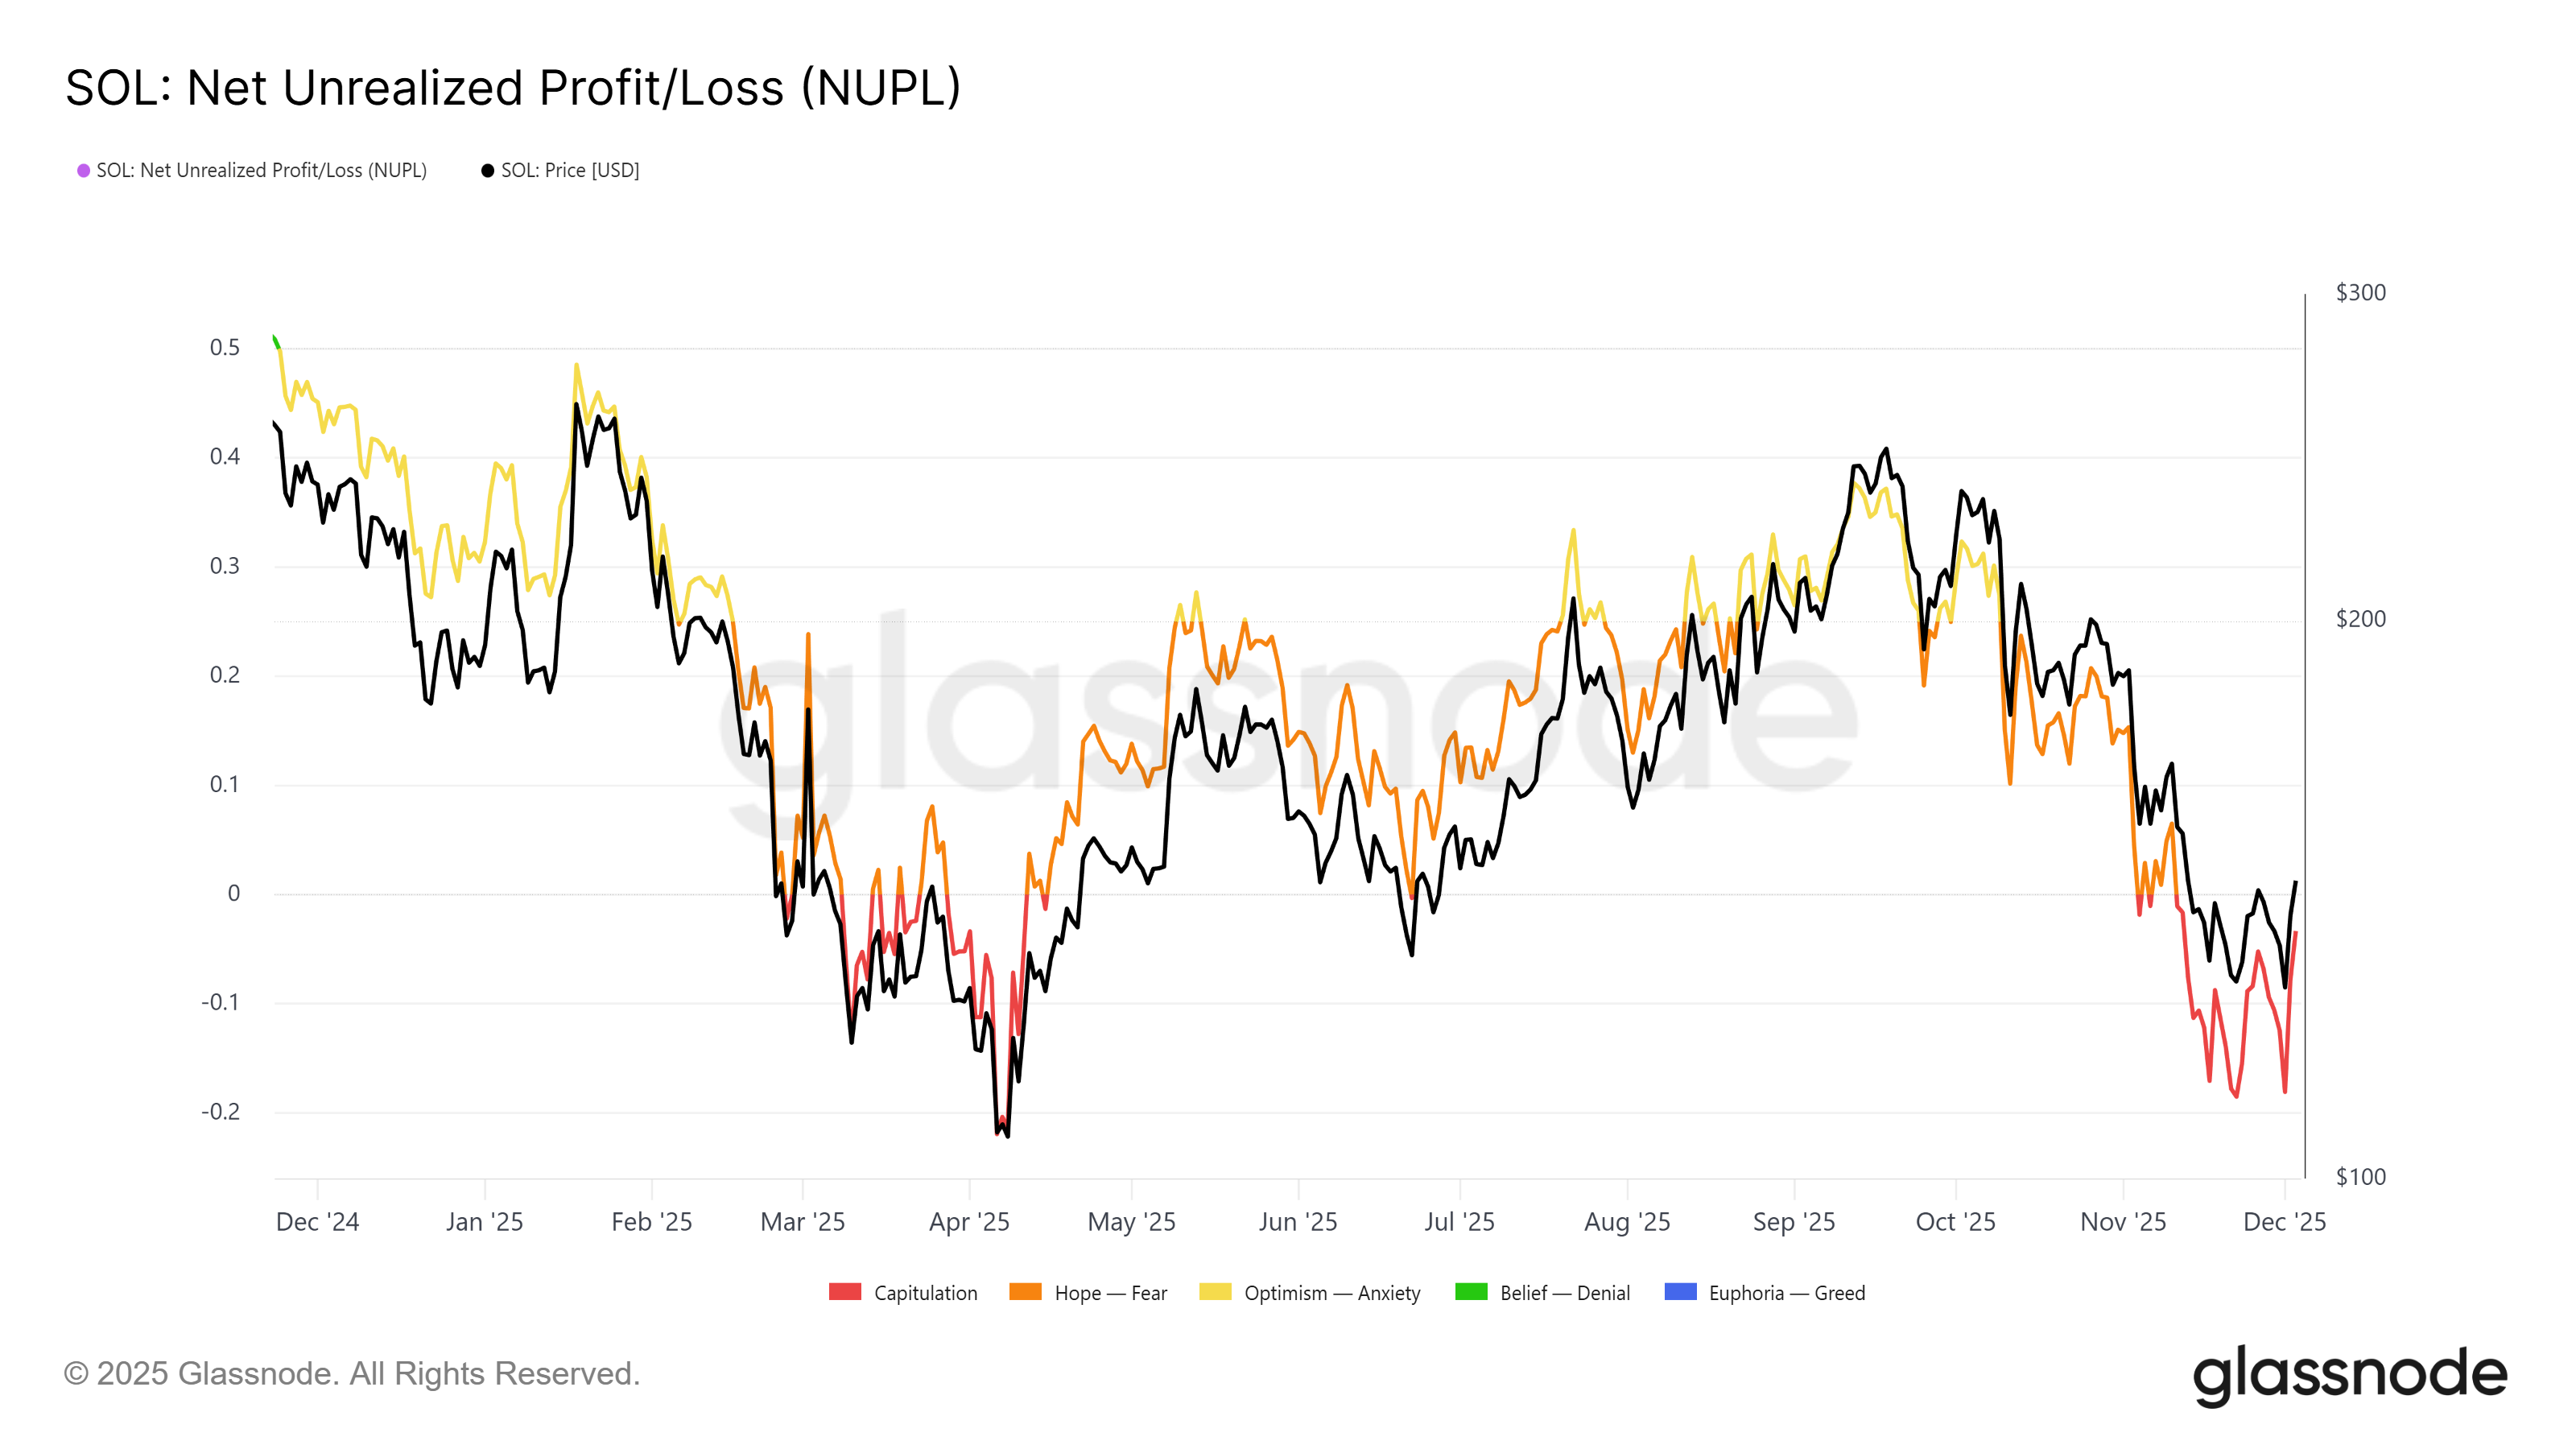
Solana’s Net Unrealized Profit/Loss (NUPL) metric recently dipped into the capitulation zone—a critical psychological point for investors where fear is at its highest and selling exhaustion prevails. This phase often marks the early stages of trend reversals, creating favorable conditions for accumulation.
SOL has experienced this capitulation phase before; in April, NUPL also entered into this zone before a significant rally took the token to new heights. With the indicator currently suggesting selling exhaustion, Solana could be setting itself up for a similar resurgence, provided that market sentiment continues to stabilize.
Solana NUPL. Source: Glassnode
SOL Price Breakout Ahead
At present, Solana is forming a double-bottom “W” pattern, a classic bullish indicator that implies a potential 14% breakout toward $165. A confirmed breakout from this formation would validate the bullish reversal, placing SOL back on an upward trajectory.
Currently trading at approximately $143, SOL is approaching the critical resistance level of $146. If it can clear this resistance—bolstered by improving sentiment and positive on-chain trends—it could surge towards $157. Overcoming that hurdle would pave the way for even higher targets at $163 and ultimately reach the $165 mark.
Solana Price Analysis. Source: TradingView
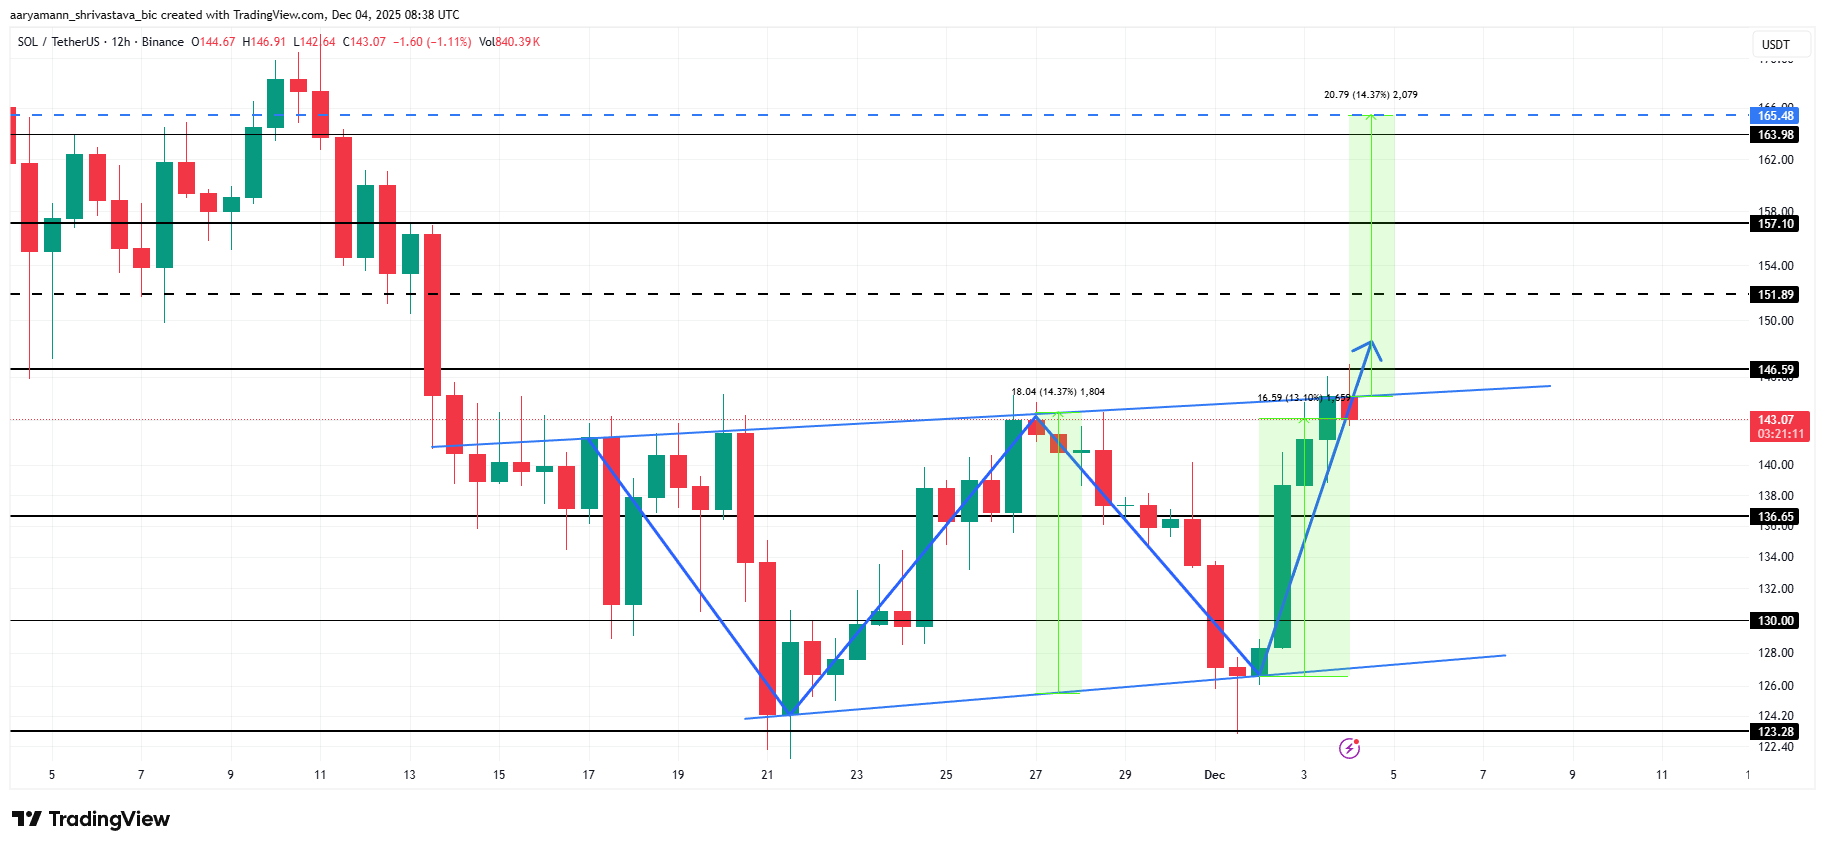
However, investors should be cautious. A failed breakout or renewed market weakness could invalidate this bullish pattern. If that scenario plays out, Solana may retrace back to its support level of $136. A drop below this support would suggest a delay in recovery efforts and could potentially invalidate the optimistic outlook projected by the current patterns.
As Solana’s landscape evolves, market participants are keenly watching these developments. The interplay of LTH sentiment, price patterns, and market conditions will be instrumental in shaping Solana’s trajectory in the near future.