
Bitcoin Market Analysis: Navigating the Current Trends
Bitcoin has recently experienced a significant downturn, falling below the $100,000 mark for the second time in just one week. This decline comes amidst a broader crypto market loss exceeding $700 billion, contributing to a monthly decline of 12% for Bitcoin itself. As the Fear and Greed Index plummets to an alarming low of 10, investors and analysts alike find themselves questioning whether we are on the brink of a bear market.
Analyzing Market Sentiment and Indicators
The Importance of Sentiment Signals
The Fear and Greed Index is a critical barometer for market sentiment. Currently, with a reading of 10, we’re witnessing extreme fear—an echo of market anxieties akin to those observed in early and mid-2022, which were recognized as definitive bear market periods. The index has seen a drastic decline, falling from 28 just a month ago to 16 last week. This indicates a growing anxiety among investors, one that typically heralds a prolonged downturn.
Source: Alternative
While sentiment indicators provide a snapshot of market psychology, they do not unequivocally confirm the onset of a bear market. Instead, these readings often reflect investor capitulation or fatigue, serving as a precursor to potential shifts in market dynamics.
Bitcoin’s Major Support Levels
Another crucial technical indicator is the 365-day moving average (MA), currently hovering around $102,000. Bitcoin’s recent trading below this level mirrors the patterns seen in December 2021, where a similar breach preceded a months-long bear market. Historically, failing to reclaim this crucial support swiftly has signaled a shift from bullish to bearish market regimes.
Current Market Conditions and Technical Analysis
On-Chain Metrics and Early Capitulation
The UTXO (Unspent Transaction Output) 6-12 month realized price sits at about $94,600, slightly above the current Bitcoin price. This group consists of investors who entered the market during previous bullish cycles, reflecting their optimism and confidence. Should these holders start to incur losses, market sentiment could deteriorate further. Such a scenario echoes 2021’s circumstances when Bitcoin fell below these cost baselines, marking the onset of a lengthy decline.
Relative Strength Index (RSI) Calculation
The Relative Strength Index (RSI) indicates that the current market condition is oversold, with Bitcoin’s RSI among the lowest in comparison to other large-cap crypto assets. With only 2.5% of the market in overbought territory, the majority remain in an oversold zone.
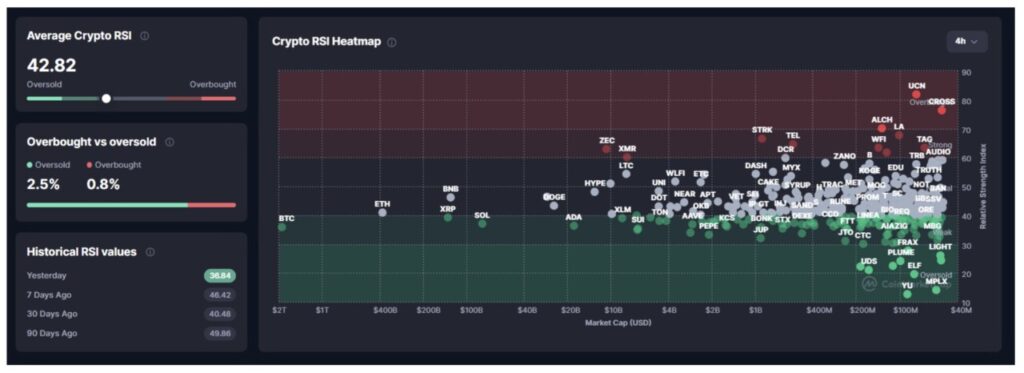
Source: CoinMarketCap
This situation mirrors past mid-cycle corrections observed in May-July 2021 and August 2023, where similar conditions did not lead to a long-term bear trend.
MACD Divergences and Market Transitional Phases
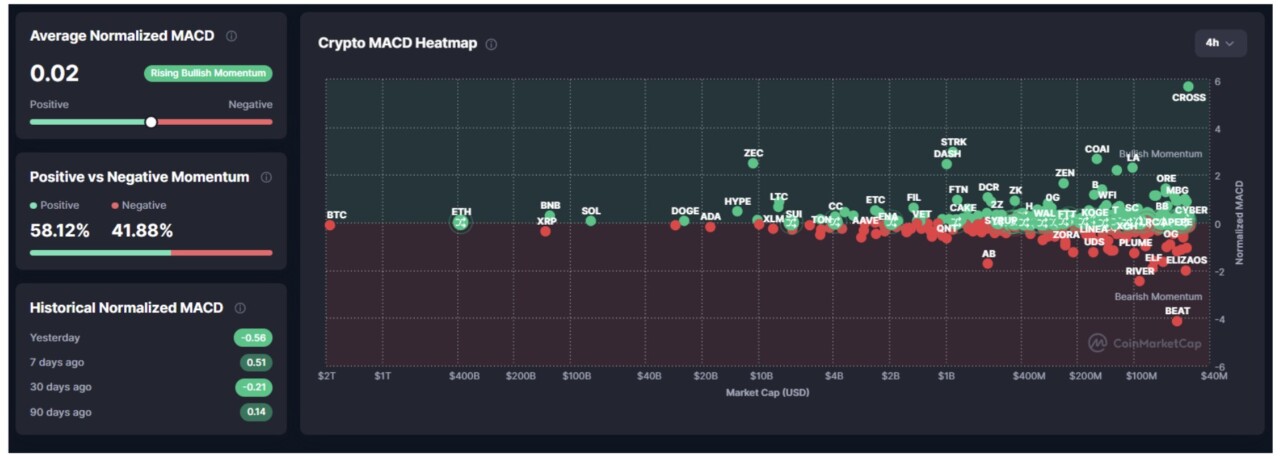
The moving average convergence divergence (MACD) currently reflects a weak bullish momentum with about 58% of crypto assets showing positive movement. However, Bitcoin remains stuck in a deep negative zone, illustrating a divergence that signalizes a transitional phase rather than a systemic downward trajectory.

Source: CoinMarketCap
In a fully-fledged bear market, an overwhelming majority (over 90%) of crypto assets typically yield negative MACD signals. As of now, this condition has not been observed, reinforcing the idea that the market might be in an adjustment phase.
Are We Entering a Bear Market?
At this juncture, the crypto market has not clearly transitioned into a bear market. Rather, it appears to be undergoing a mid-cycle correction, with potential indicators of a bearish trend depending on forthcoming developments.
Key Conditions to Monitor
Several pivotal criteria will define whether we transition into a bear market:
- Bitcoin’s Position Relative to the 365-Day MA: If Bitcoin remains below its 365-day moving average for 4-6 weeks, it could replicate patterns that initiated bearish trends in previous years.
- Long-Term Holder Distribution: A massive distribution by long-term holders (LTH) that exceeds 1 million BTC within 60 days could signify that the peak cycle has been reached.
- Overall Market MACD: A negative MACD across the entire market is a crucial indicator that has yet to materialize.
Overall, while we are not yet in a confirmed structural bear trend, the precarious price positioning of Bitcoin and existing technical pressures place the market in a precarious zone. Should current resistance levels fail to hold, a bear market could very well emerge in the near term.
Frequently Asked Questions
What is the Fear and Greed Index?
The Fear and Greed Index is a tool that gauges crypto market sentiment, where low values indicate extreme fear and high values indicate extreme greed.
Why is the 365-Day Moving Average important for Bitcoin?
The 365-day moving average serves as a critical long-term structural pivot, reflecting Bitcoin’s price trend over the past year.
What is UTXO?
UTXO, or Unspent Transaction Output, refers to the output from a Bitcoin transaction that has not yet been spent and can be reused as input for a new transaction.
For the latest updates on crypto trends, follow us on Google News and explore Pintu Academy for comprehensive insights into the crypto world. Download the Pintu crypto app for a seamless trading experience today.