
Ethereum’s Price Action: A Deeper Dive into Market Dynamics
Ethereum, the second-largest cryptocurrency by market capitalization, has recently experienced a period of nearly stagnant price movement. Despite the cacophony of predictions echoing in the crypto space, the reality is that Ethereum’s value has barely budged over the past week. However, a closer examination reveals that beneath the surface, critical developments are unfolding in both its chart patterns and on-chain metrics.
The Technical Picture: Inverse Head-and-Shoulders Setup
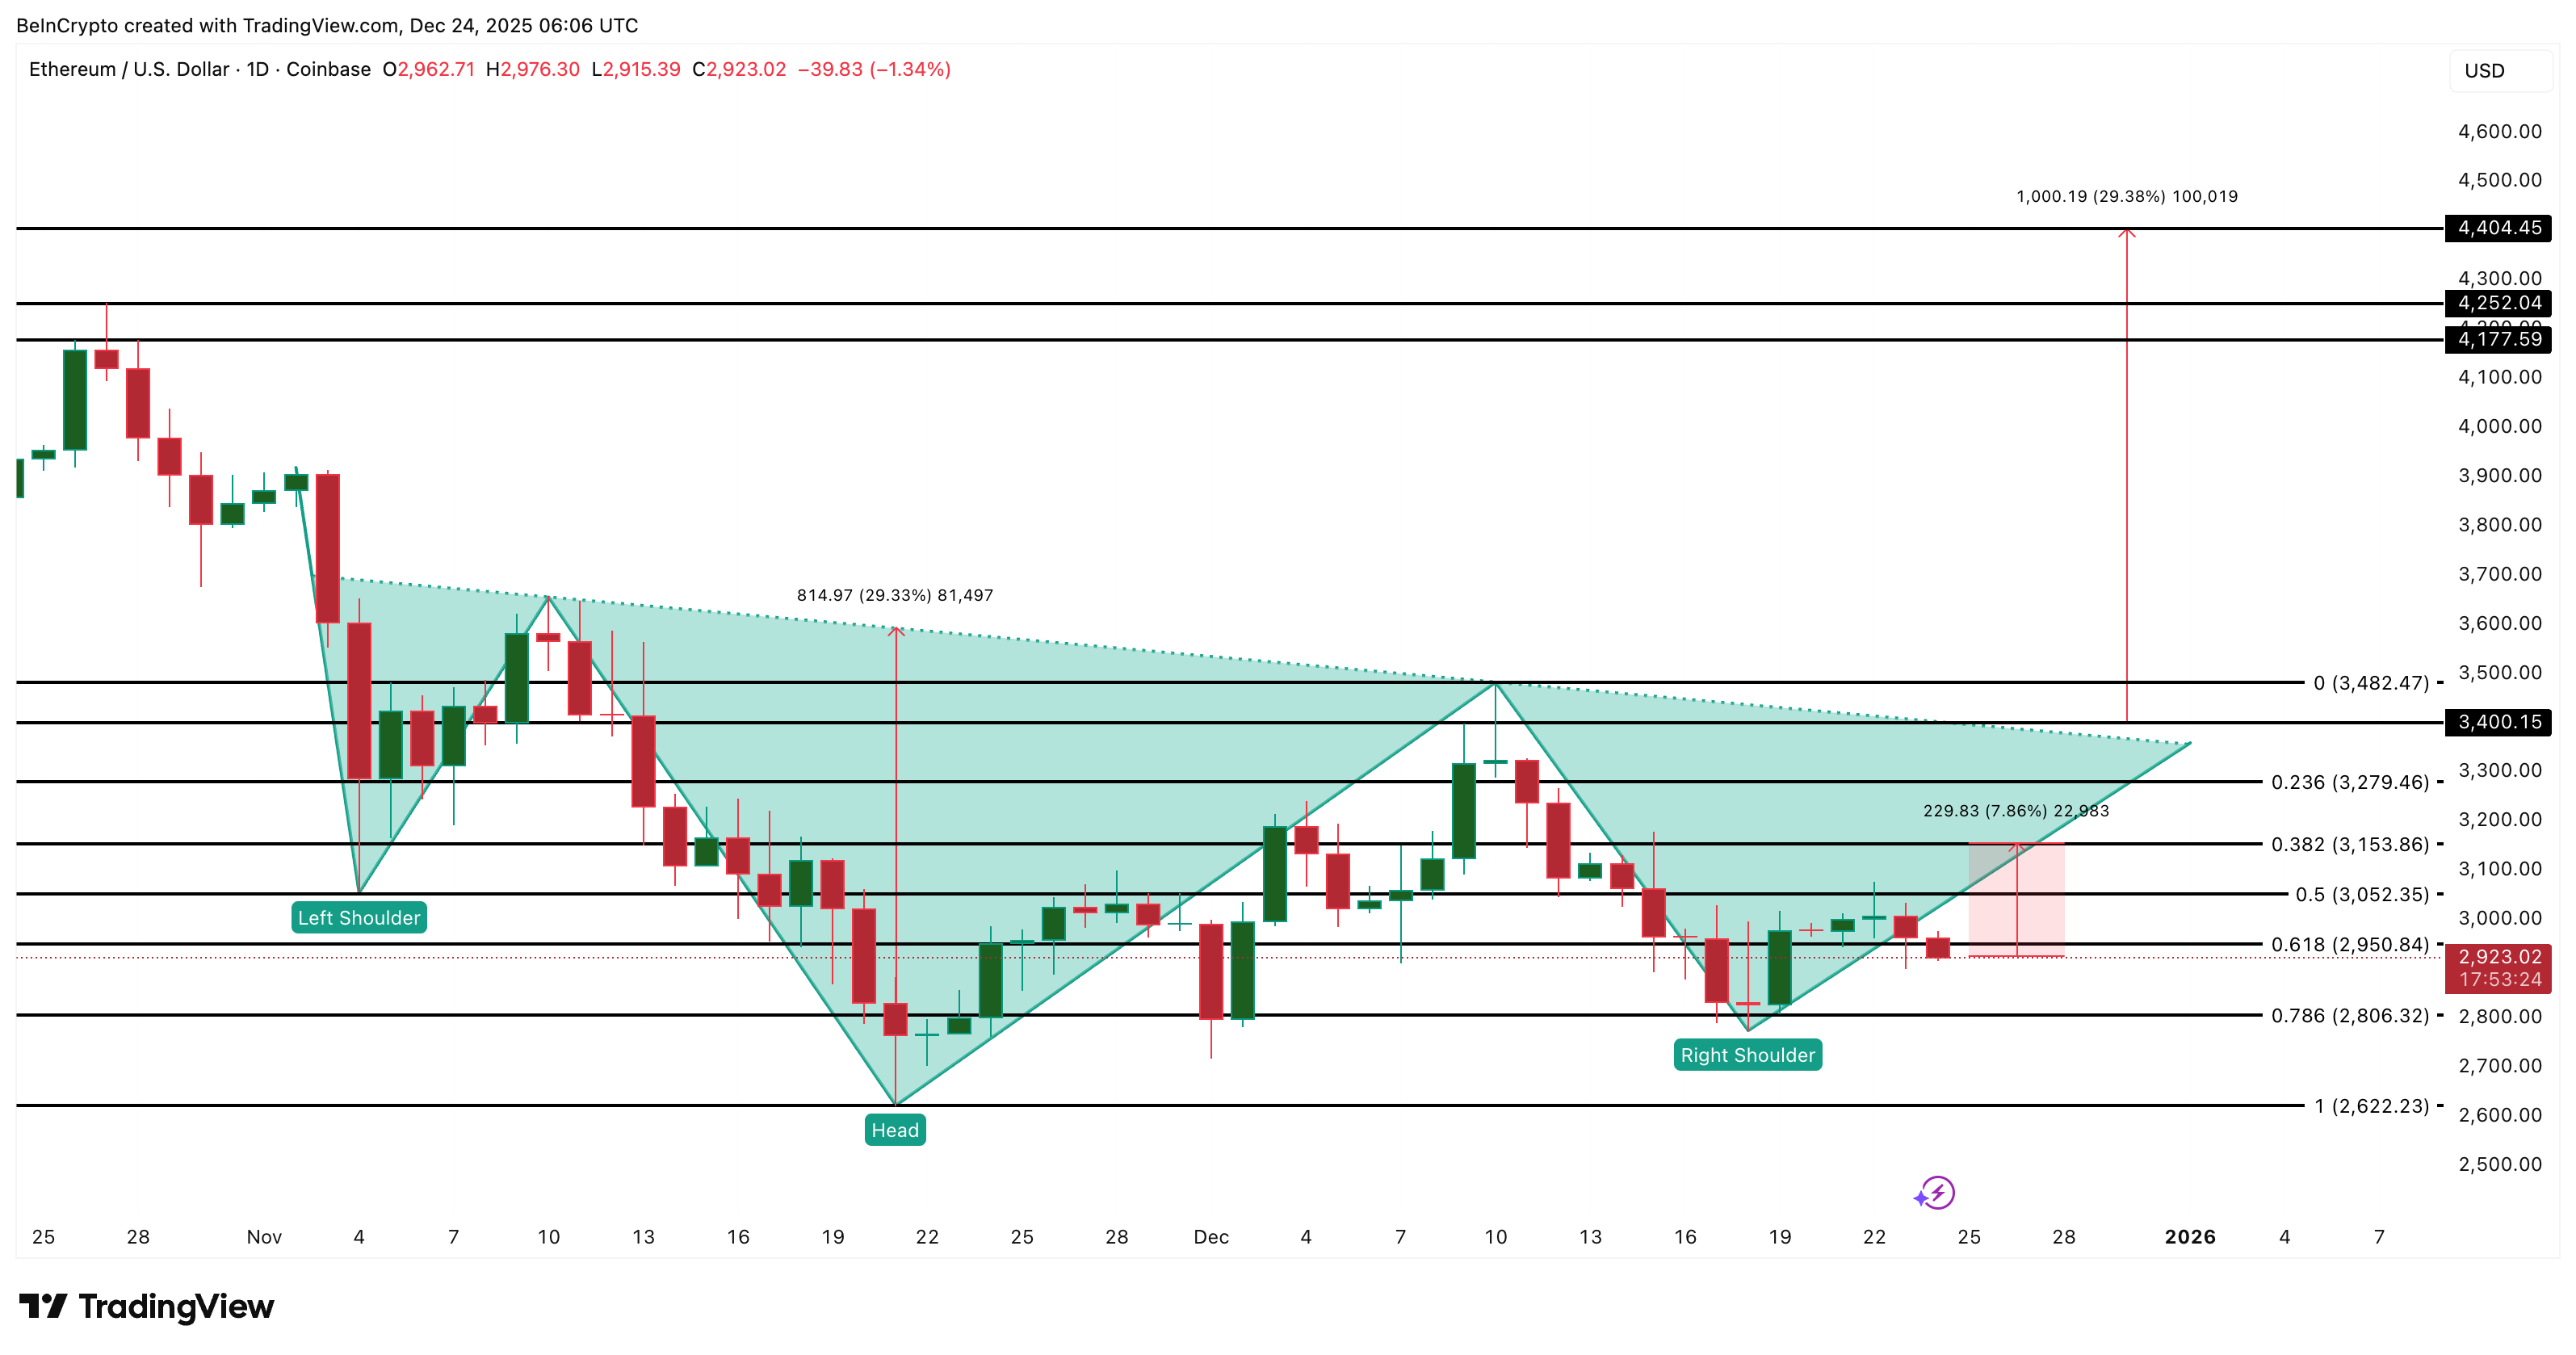
Starting with the technical analysis, Ethereum appears to be forming an inverse head-and-shoulders reversal pattern on its daily chart. This well-defined pattern showcases a relatively flat neckline situated in the $3,400 zone, which is crucial. A flat neckline is often an indicator of stronger follow-through when the price eventually breaks above it.
If Ethereum manages to close above this neckline decisively, we might see the price move toward a target of approximately $4,400. This target is derived from the height of the head projected upward, making the technical setup particularly enticing for traders.
On-Chain Dynamics: Long-Term Holder Activity
What makes this setup even more fascinating is the on-chain data. Specifically, the Hodler Net Position Change metric provides insight into the behavior of long-term holders. Since late November, this metric has shown a dramatic decrease in selling activity from holders. While they had been selling approximately 1.1 million ETH, that figure dwindled to just 54,427 ETH by December 23—a staggering reduction of over 95%.
This decline in selling pressure is particularly significant, as long-term holders typically abstain from selling during pivotal market moments. Coupled with the developing breakout pattern, this reduced selling suggests that supply is decreasing rather than increasing, thereby establishing a robust foundation for potential upward momentum.
Key Resistance Zones and Cost Basis Levels
As Ethereum approaches possible breakout points, it’s crucial to consider key resistance zones. Understanding the cost basis levels—where significant amounts of ETH were last acquired—can provide insight into potential price barriers. The most critical cluster lies between approximately $3,150 and $3,173, where around 2.94 million ETH were accumulated. This range constitutes a formidable supply wall that traders should watch closely.
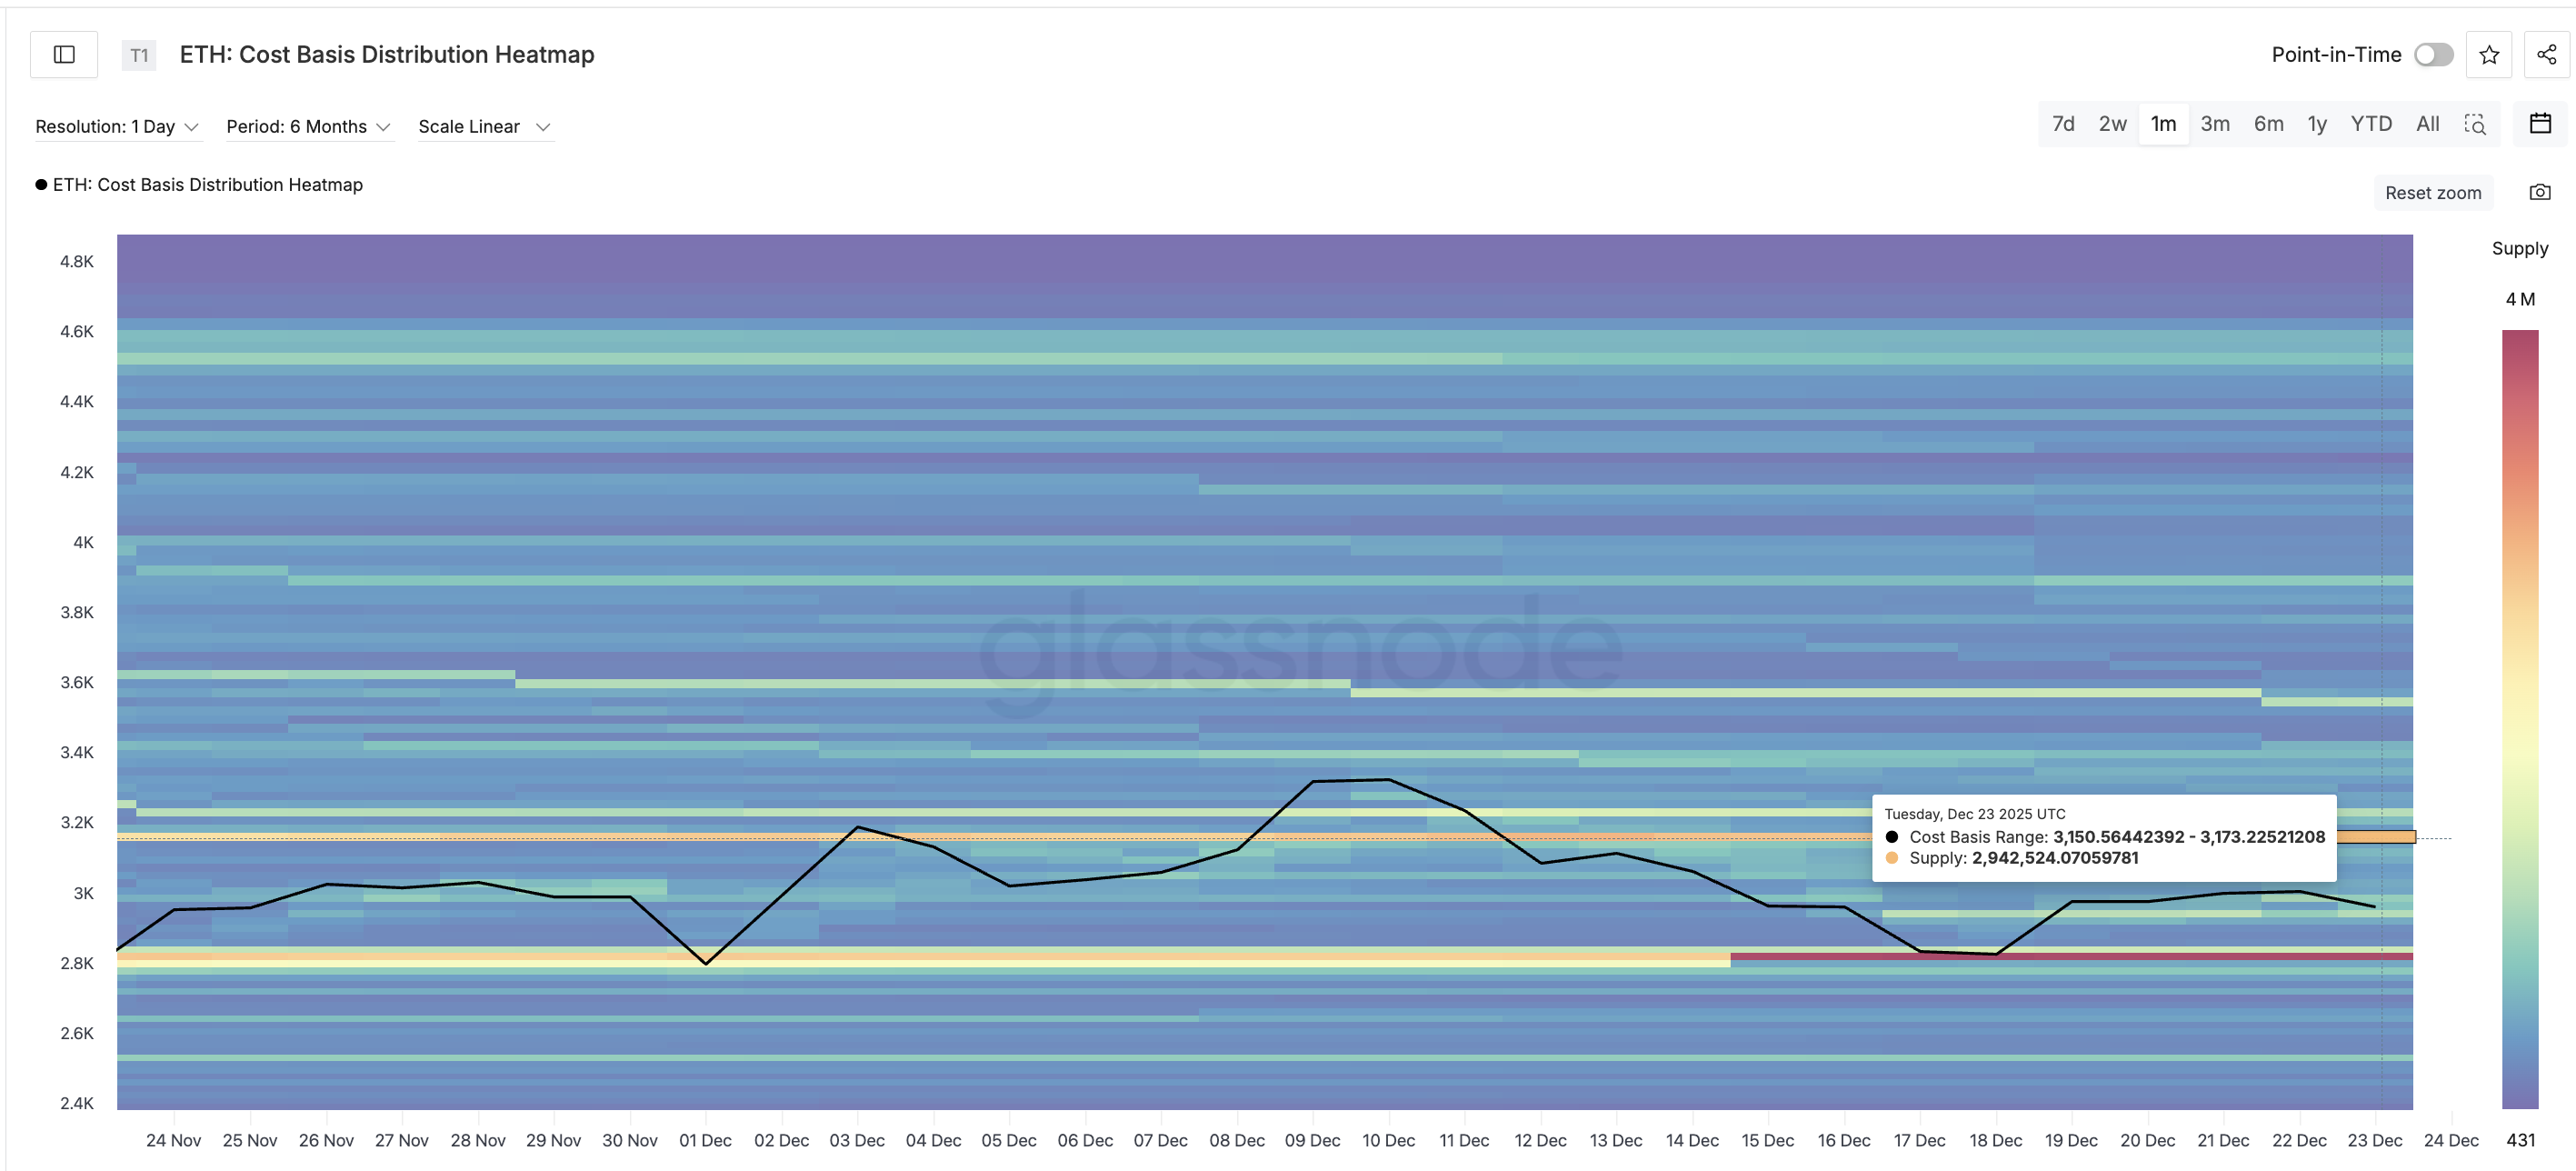
A sustained movement above this cost basis zone would clear the path toward the aforementioned $3,400 neckline. Achieving this would represent about a 7% increase from current price levels, further validating the importance of the $3,150 resistance.
Once Ethereum surpasses the neckline, it would face another significant resistance near $3,480, followed by a relatively thin barrier until around $4,170. A bullish momentum could propel the price closer to the $4,400 target derived from the inverse head-and-shoulders pattern.
Calculating Risks: A Defined Support Zone
While the bullish scenario appears increasingly probable, it’s essential to remain cognizant of potential risks. If Ethereum falls below $2,800, the strength of the current structure may weaken substantially. A drop beneath $2,620 would effectively nullify the bullish setup, indicating a potential resurgence of selling pressure.
In summary, the convergence of a textbook reversal pattern, a significant decrease in long-term selling, and a clearly outlined resistance map all point to a critical juncture for Ethereum. The upcoming movements hinge on the cryptocurrency’s ability to maintain a clean close above the $3,150 supply wall, which could signal the beginning of a substantial upward trend.