")
Ethereum’s Bullish Surge: Climbing Towards $4,000
Ethereum’s price has recently demonstrated an impressive upward trend, consistently marked by higher highs and higher lows. This bullish movement is bringing Ethereum closer to a significant psychological level—$4,000. While the general sentiment and technical indicators suggest further upside potential, it’s essential to approach this momentum with caution as a market pullback may be on the horizon.
The Daily Chart
Analyzing the daily chart reveals Ethereum’s journey through a large ascending channel. This upward trajectory kicked off around mid-April, with several resistance levels successfully breached. Currently, the 100-day and 200-day moving averages lie below the price, indicating strong support. Notably, the 100-day MA recently displayed an upward slope following a bullish crossover, adding to the bullish narrative.
The current market landscape raises optimism about potentially breaking the recent high of $4,107. Should Ethereum break out of its ascending channel on the upside, it could pave the way for new all-time highs in the forthcoming months. Conversely, if the price experiences a rejection at the upper trendline of the channel, it could retrace toward the $3,200 region. This area becomes crucial as it will determine whether the market is poised for a short-term correction or a more severe reversal.
Source: TradingView
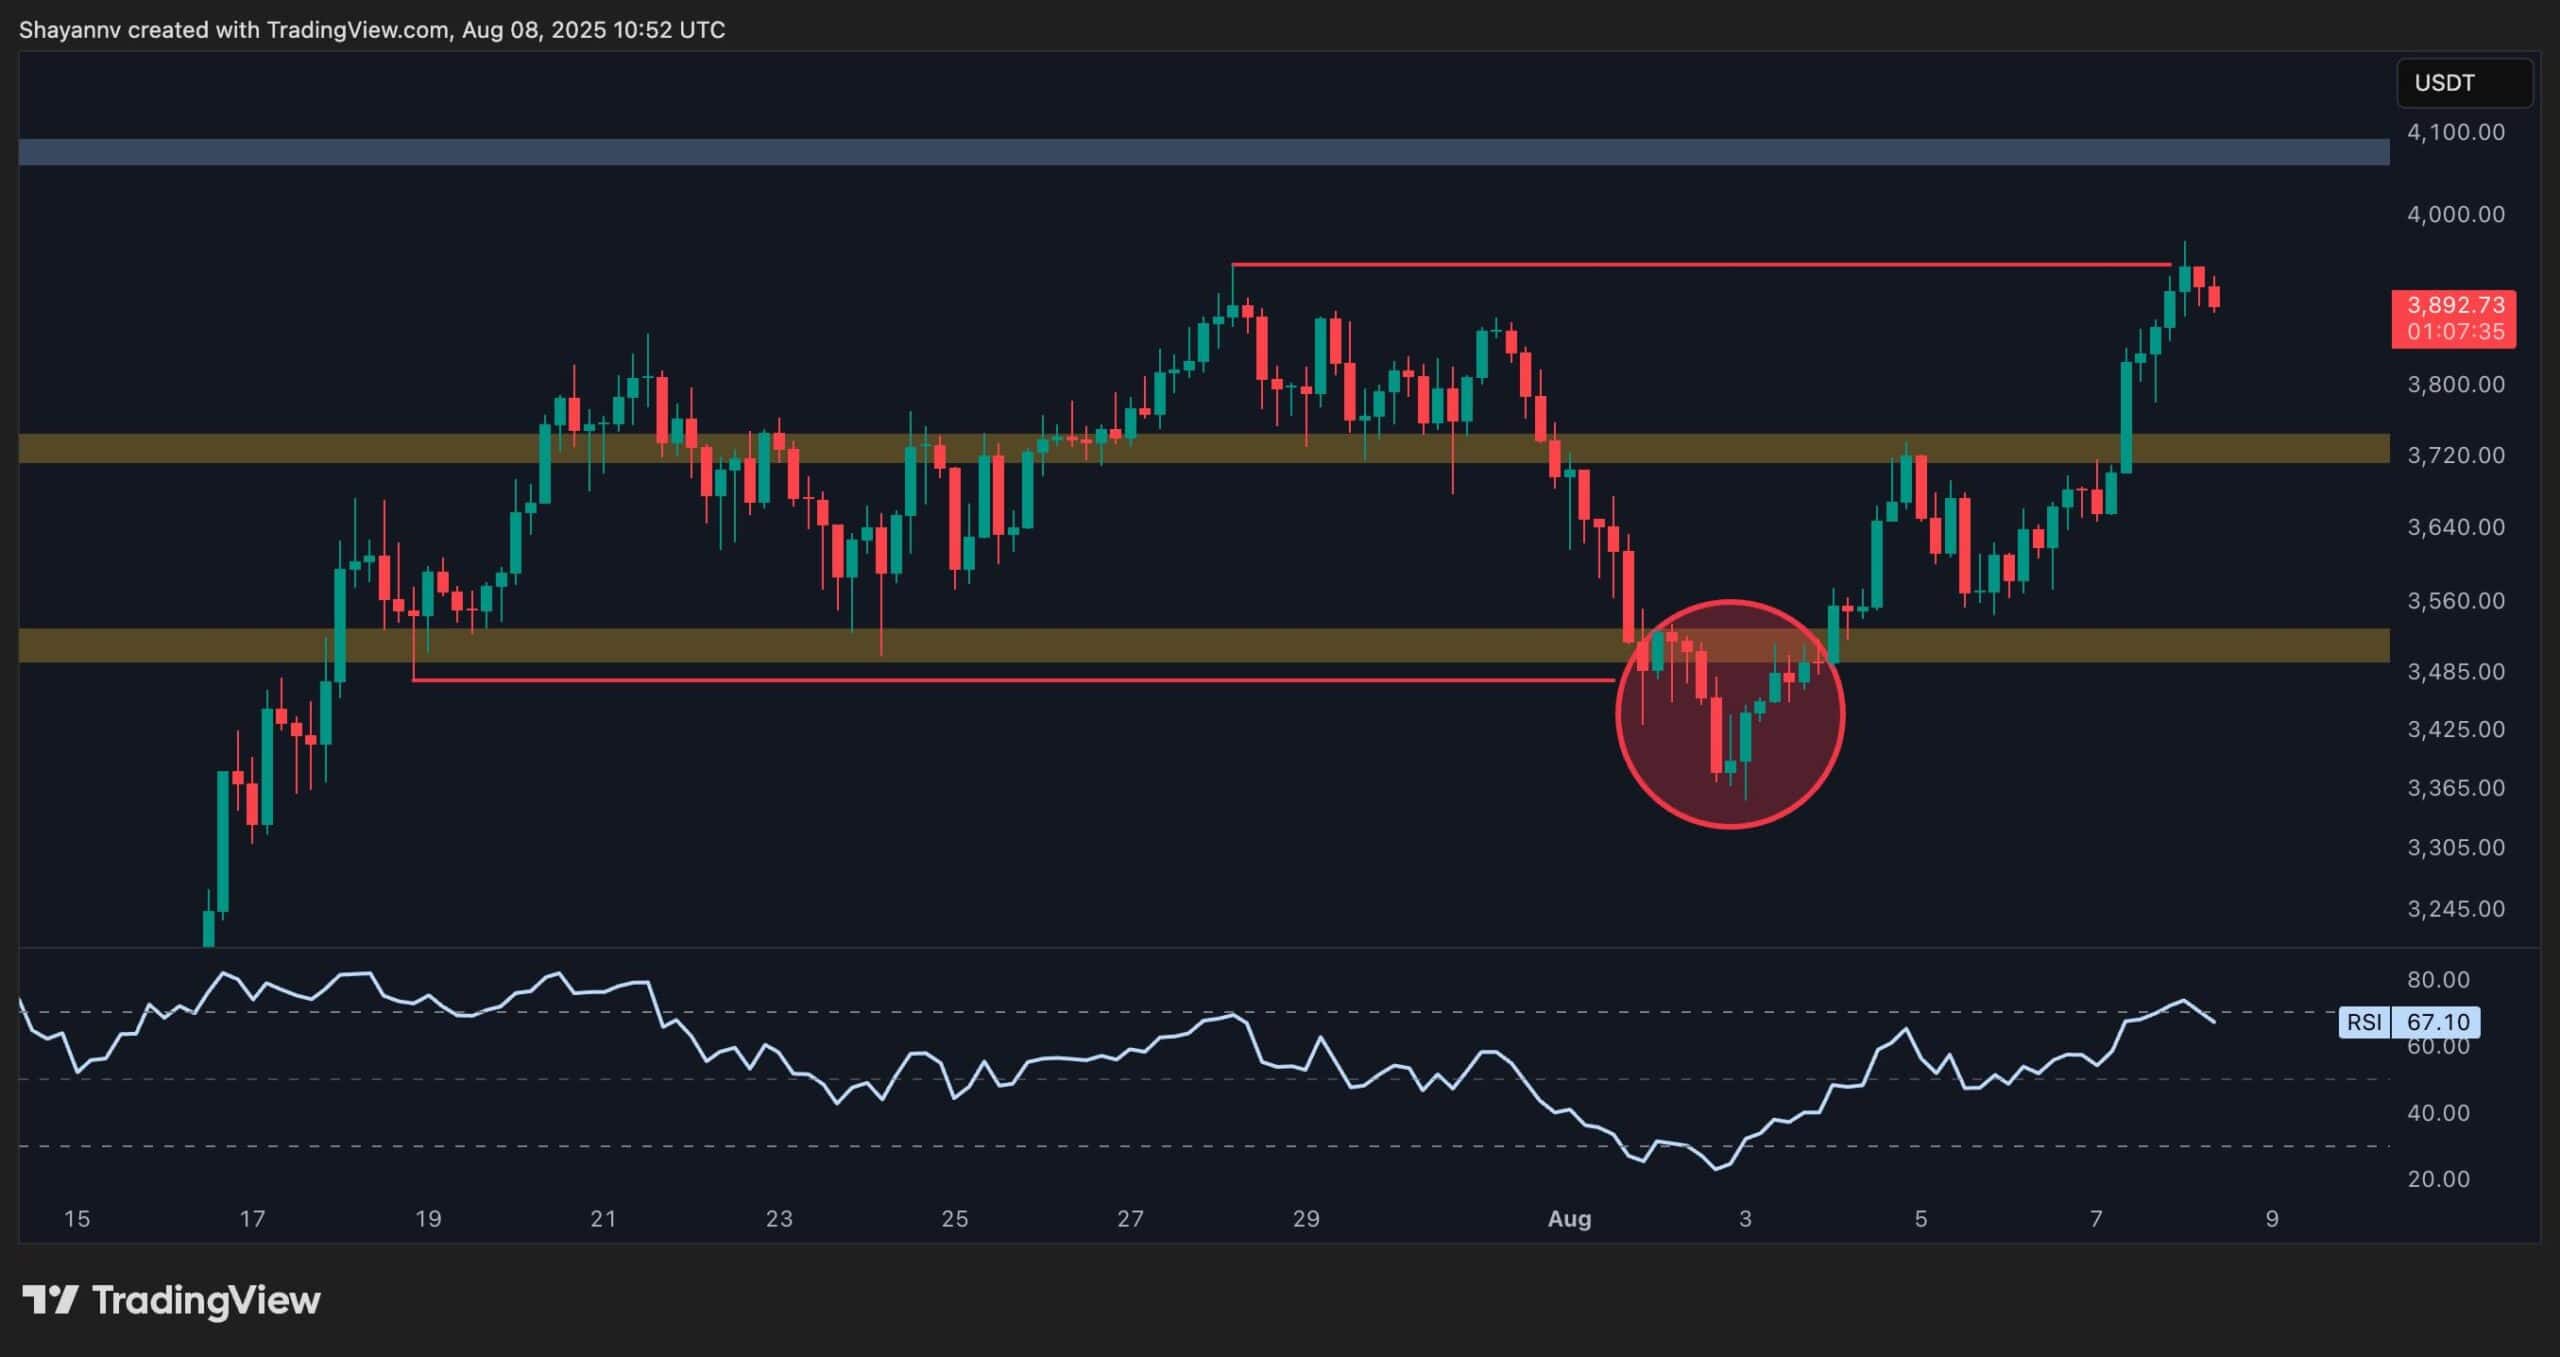
The 4-Hour Chart
Diving into the 4-hour chart, a noteworthy reaccumulation phase is evident, typically observed following significant price rallies. Ethereum’s price has been consolidating between the $3,500 and $3,800 levels, punctuated by a brief fake breakout and subsequent liquidity sweep below $3,500.
Currently, the price flirts with breaking above the recent $3,900 high once again. If an impulsive follow-up occurs, we could witness an aggressive rally as Ethereum aggressively pursues a new all-time high. The Relative Strength Index (RSI) sits around 67, showcasing bullish momentum but also signaling a potential overbought condition in the near future. However, an overbought status doesn’t automatically suggest a market reversal; a bearish divergence must occur first before any significant downturn can be anticipated.
Source: TradingView
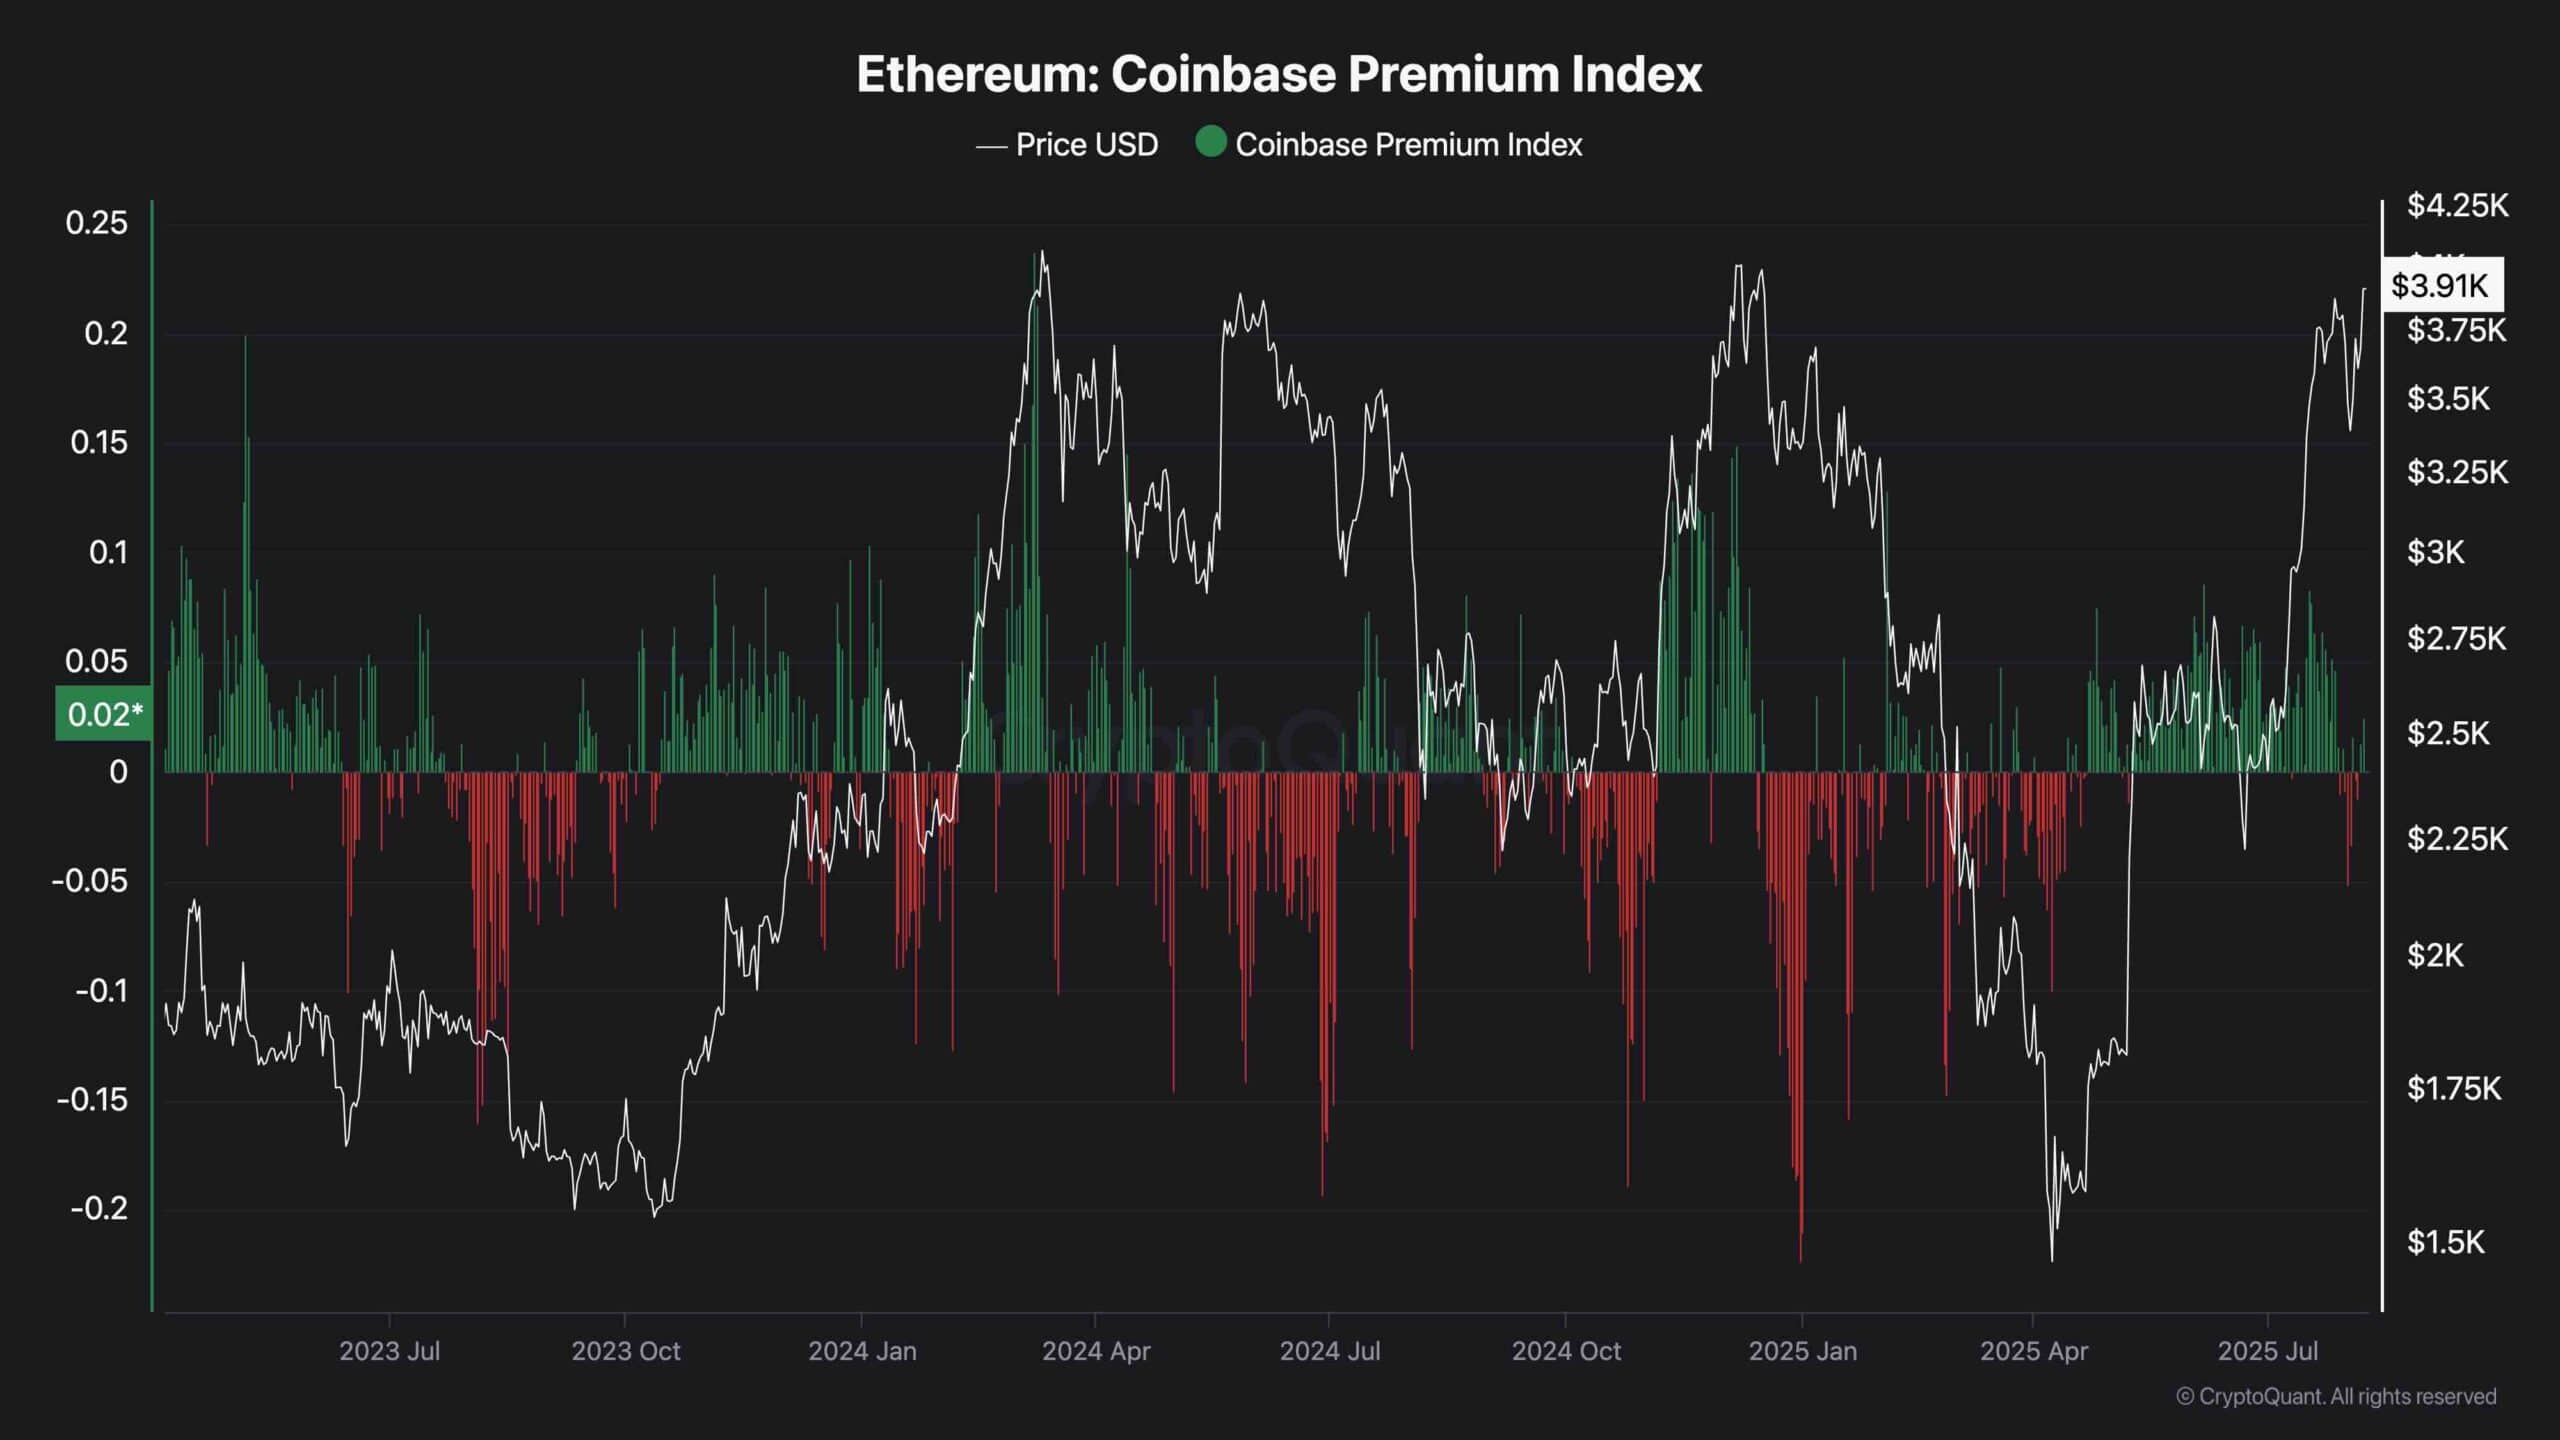
Coinbase Premium Index
The Coinbase Premium Index offers valuable insight into market sentiment, measuring the price discrepancy between Bitcoin on Coinbase and Binance. Throughout the current rally that started in April, this index has mostly maintained positive values, indicating robust demand from American investors when compared to global counterparts.
Historically, a positive Coinbase Premium Index has shown a strong correlation with price increases. As positive values typically precede bullish rallies, this trend suggests a higher probability of continued upward movement in Ethereum’s price rather than a swift reversal. The prevailing market sentiment corroborates the bullish technical chart patterns, painting an optimistic picture for Ethereum’s future price trajectory.
Source: TradingView
Attention to Market Dynamics
As Ethereum nears the crucial $4,000 mark, traders and investors should remain vigilant. While the market appears predominantly bullish, external factors and market sentiment can shift rapidly. Keeping an eye on both technical indicators and sentiment metrics will be crucial in navigating the upcoming phases of this volatile market.
In an ever-evolving landscape, understanding the interplay between chart patterns, investor sentiment, and macroeconomic factors will remain key for anyone looking to engage with Ethereum’s exciting journey.