
Bitcoin (BTC) continues to trade within the recent consolidation phase, hovering around $90,000 at the time of writing on Friday, as investors digest the Federal Reserve’s (Fed) cautious December rate cut and its implications for risk assets.
BTC price action approaches a key descending trendline that could determine its next directional move. Meanwhile, institutional flows into Spot Bitcoin ETFs showed mild inflows, and Strategy added more BTC to its treasury reserve.
Fed’s Policy Tone Triggers Consolidation in Bitcoin
Bitcoin price started the week on a positive note, extending its weekend recovery during the first half of the week and holding above $92,600 on Tuesday. However, momentum softened on Wednesday, with BTC closing at $92,015 after the Federal Open Market Committee (FOMC) meeting.
In a widely expected move, the Fed lowered interest rates by 25 basis points. Yet the FOMC meeting signaled a likely pause in January, contributing to a cautious market tone.
Adding to the caution, policymakers projected only a single quarter-percentage-point cut for the overall 2026 outlook, mirroring September’s stance. This tempered market expectations of further rate cuts and exerted short-term pressure on risk assets, including Bitcoin. The largest cryptocurrency by market capitalization slid to a low of $89,260 before rebounding above $92,500 on Thursday.
With no major US data releases ahead, crypto markets now look to FOMC member speeches and broader risk sentiment for direction as the week draws to a close. BTC is likely to consolidate in the near term unless a significant catalyst emerges.
Russia-Ukraine Uncertainty Limits Risk-on Momentum
On the geopolitical front, US President Donald Trump expressed his frustration with Russia and Ukraine, indicating that he doesn’t want any further discussions. Earlier, Ukrainian President Volodymyr Zelenskyy mentioned that the US was urging Ukraine to cede land to Russia as part of a potential agreement to end the nearly four-year conflict.
These ongoing geopolitical tensions and stalled peace talks continue to weigh on global risk sentiment, limiting risk-on appetite and contributing to Bitcoin’s consolidation this week.
Institutional Demand Sees Mild Signs of Improvement
Institutional demand for Bitcoin is showing mild signs of recovery. According to SoSoValue data, US-listed spot Bitcoin ETFs recorded a total inflow of $237.44 million through Thursday, following a minor outflow of $87.77 million the previous week, signaling a slight uptick in institutional investor interest.
However, these inflows remain modest compared to mid-September levels. For BTC’s recovery to gain momentum, ETF inflows would need to increase significantly.
On the corporate front, Strategy Inc. (MSTR) purchased 10,624 BTC for $962.7 million between December 1 and 7 at an average price of $90,615, raising its total holdings to 660,624 BTC, valued at approximately $49.35 billion. The firm retains significant capacity to raise additional capital, potentially enabling further large-scale Bitcoin accumulation.
On-Chain Data Shows Easing Selling Pressure
CryptoQuant’s weekly report indicates that selling pressure on Bitcoin is easing. The report highlights that exchange deposits shrank, as large players reduced their transfers to exchanges.
Specifically, the share of total deposits from large players dropped from a 24-hour average of 47% in mid-November to 21% as of Wednesday. Simultaneously, the average deposit reduced by 36%, from 1.1 BTC on November 22 to 0.7 BTC.
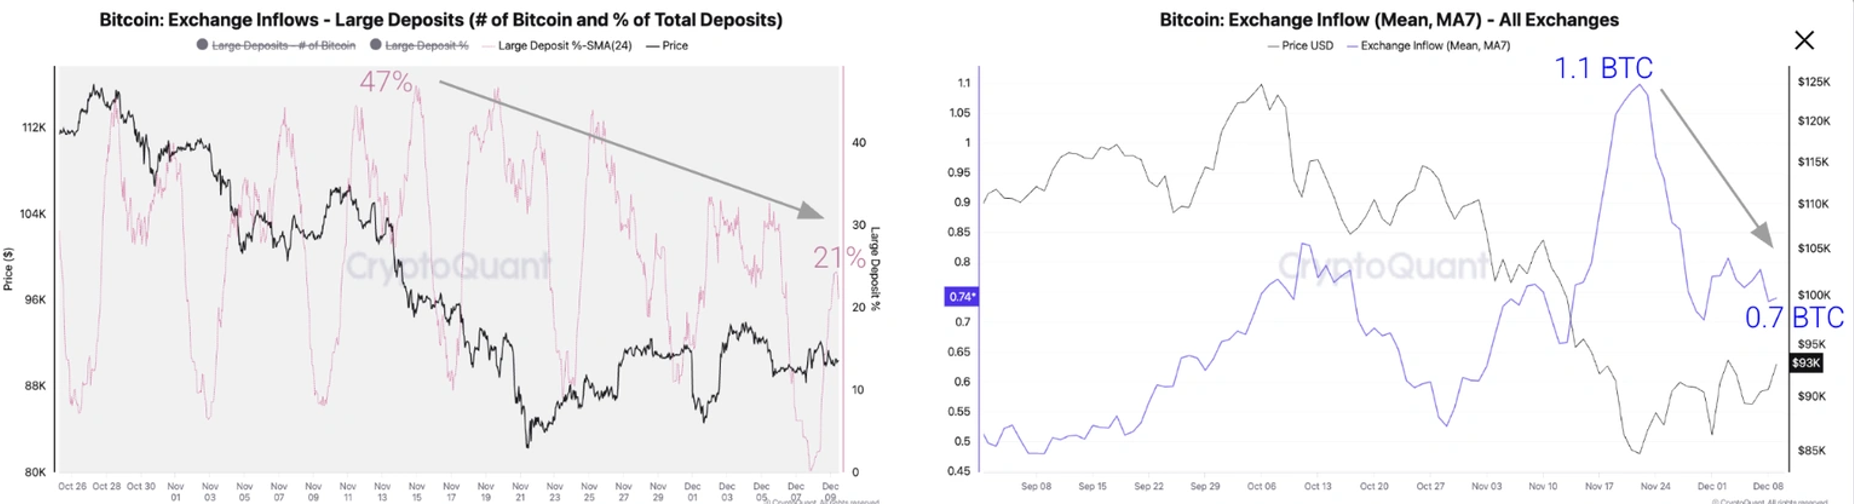
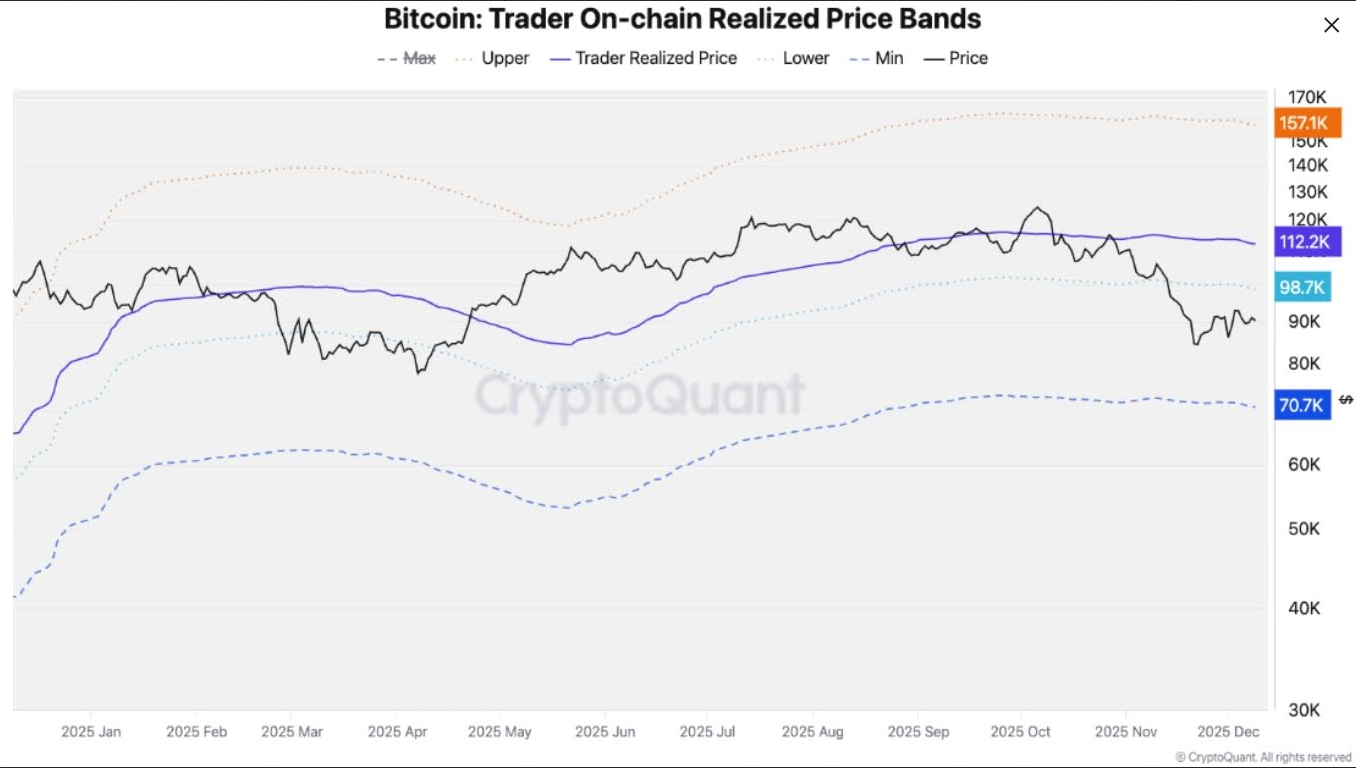
CryptoQuant suggests that if this trend continues, a relief rally could propel Bitcoin back to $99,000, which acts as a lower resistance band during bearish markets. Following this, key price resistances are located at $102,000 (one-year moving average) and $112,000 (the Trader On-chain Realized price).
A Copper Research report also exudes optimism regarding Bitcoin’s future. It posits that BTC’s four-year cycle remains intact, albeit modified. Since the inception of spot ETFs, Bitcoin has exhibited repeatable Cost-Basis Return Cycles.

Fadi Aboualfa, Head of Research at Copper, argues that since the launch of spot ETFs, Bitcoin has demonstrated repeatable mini-cycles where it retraces to its cost basis and rebounds by about 70%. Currently trading near its $84,000 cost basis, the pattern suggests a potential rise above $140,000 within the next 180 days.
If the cost basis increases by 10-15%, consistent with past cycles, this could yield a price range of $138,000 to $148,000 at previous peaks.
Bitcoin Santa Rally Ahead?
Bitcoin experienced a 17.67% decline in November, disappointing traders who had expected a rally based on historical performance for the month. December has, in contrast, historically been favorable for Bitcoin, averaging a return of 4.55%.
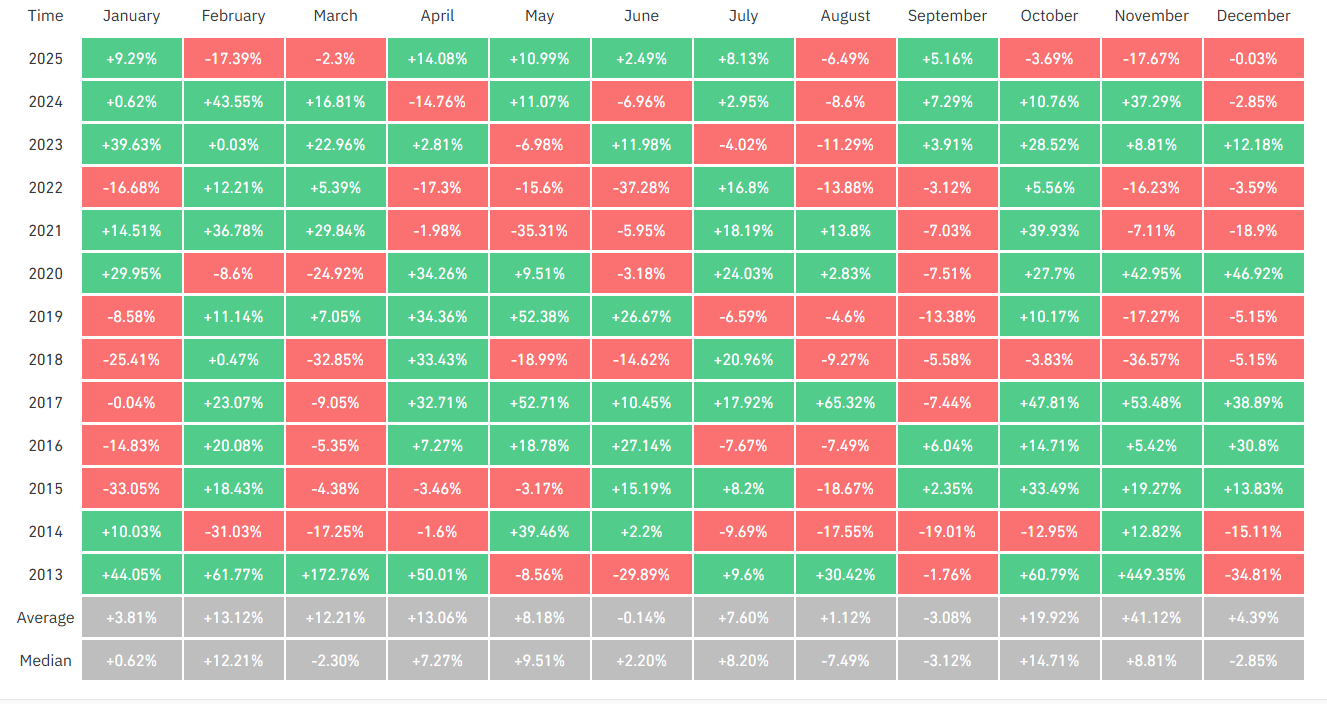
Despite this historical trend, Bitcoin’s performance in Q4 so far has been underwhelming, with a current loss of approximately 19%.
Is BTC Setting a Bottom?
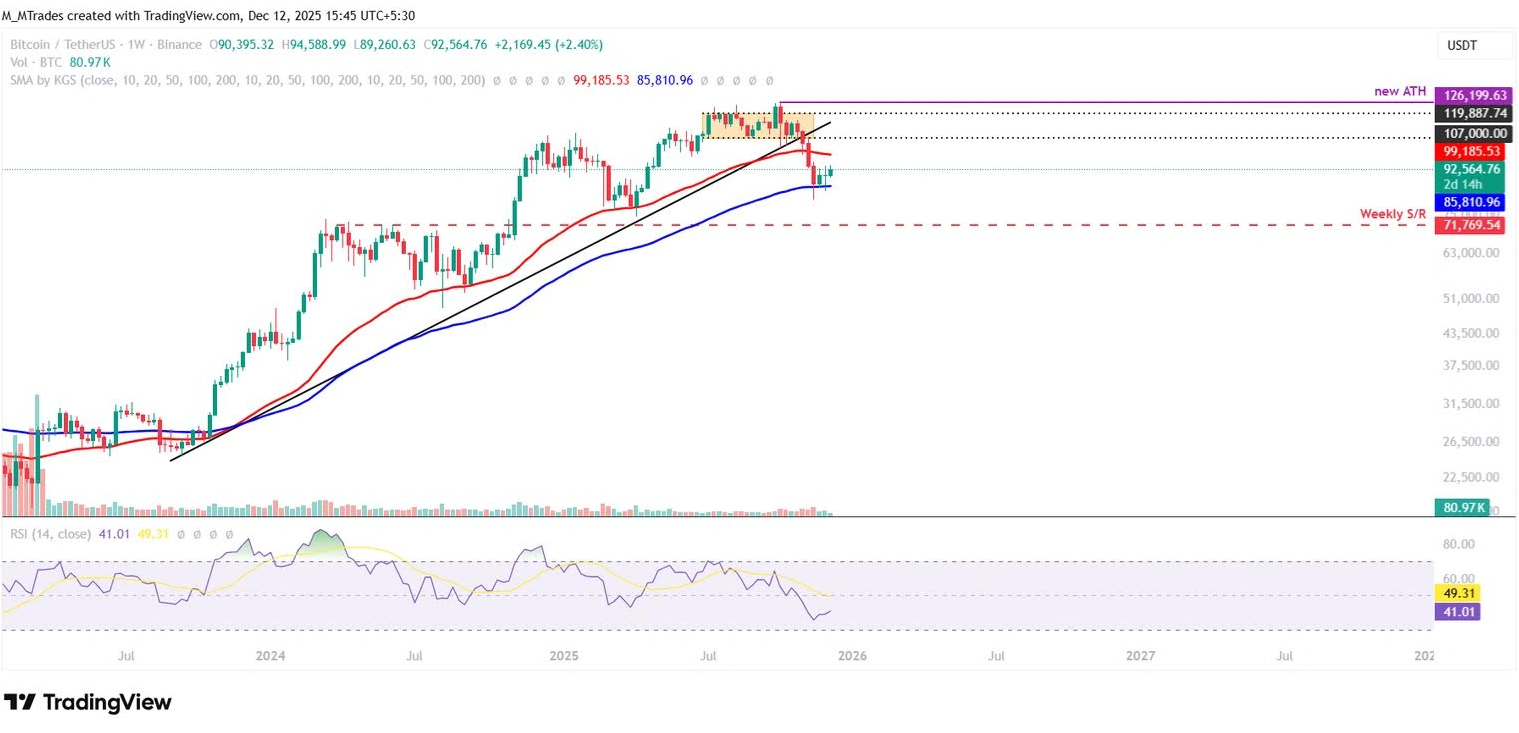
Bitcoin’s weekly chart reveals that the price is finding support around the 100-week Exponential Moving Average (EMA) at $85,809, posting two consecutive green candles following a four-week correction that began in late October. Currently, BTC is trading slightly higher, above $92,400.
If this recovery continues, BTC could target the 50-week EMA at $99,182.
The Relative Strength Index (RSI) on the weekly chart is currently at 40, trending upward, indicating diminishing bearish momentum. For a sustained recovery rally, the RSI must move above the neutral level of 50.
On the daily chart, Bitcoin was rejected at the 61.8% Fibonacci retracement level at $94,253 on Wednesday, but rebounded after testing the psychological level of $90,000 on Thursday. A breakout above the descending trendline, formed by connecting multiple highs since early October, along with a close above the $94,253 resistance level, could lead to an extended rally toward the $100,000 level.
The RSI on the daily chart remains close to the neutral 50 level, indicating a lack of near-term momentum in either direction. For sustained bullishness, the RSI would need to surpass this neutral mark. Furthermore, the Moving Average Convergence Divergence (MACD) exhibited a bullish crossover at the end of November, bolstering the bullish outlook.
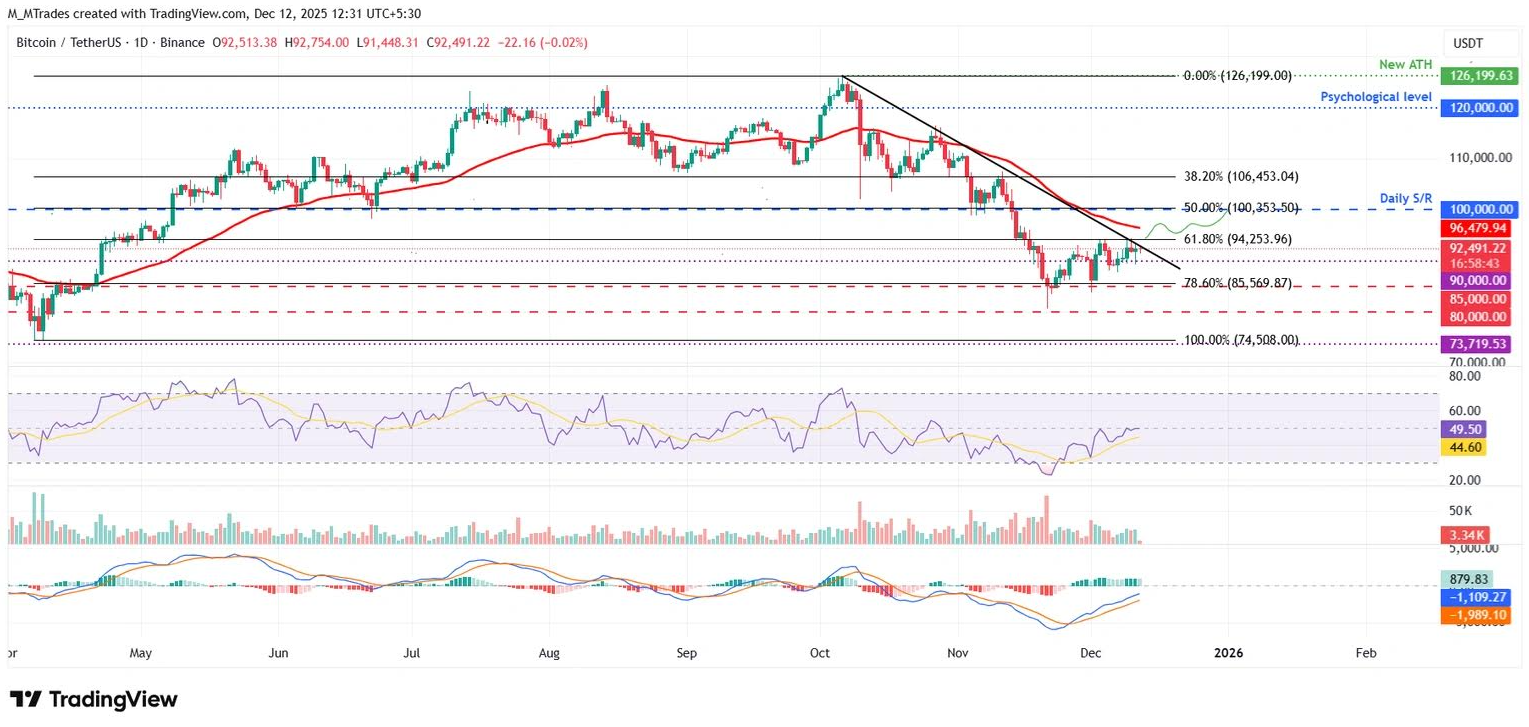
Should BTC resume its downward correction, the first key support level lies at $85,569, aligning with the 78.6% Fibonacci retracement level.