
Bitcoin, the pioneering cryptocurrency, entered July 2025 on a bearish note, showcasing a 1.3% intraday loss during Tuesday’s US market hours. This downtick signals a potential reversal within the daily channel pattern that drives the current correction trend. But does BTC’s historical July performance align with this bearish momentum, or could it rebound for a fresh breakout?
What Does History Say About Bitcoin in July?
One of the fundamental beliefs in financial market trading is that history tends to repeat itself. While not absolute, recurring seasonal patterns often help traders align their expectations with price and market behavior. In the case of Bitcoin, July has historically delivered notable growth, interspersed with occasional short-term gains.
According to CoinGlass data, BTC’s July returns over the past twelve years show only four instances of loss: -9.69% in 2024, -7.67% in 2026, -6.59% in 2019, and -4% in 2023.
Conversely, Bitcoin exhibited a bullish trend in the remaining years, with notable gains in July, including a striking 20.96% increase in 2018 and a peak return of 24.03% in 2020.
Based on these historical patterns, if history repeats itself, Bitcoin might rebound from nearby support, maintaining its price at or above $108,000.
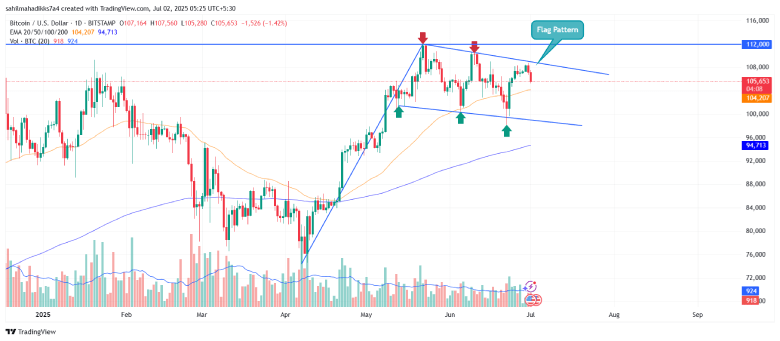
BTC Hits Major Reversal Within Flag Formation
Over the last 48 hours, the Bitcoin price has experienced a notable decline, dropping from $108,800 to $105,280, resulting in a 3.24% loss. A deeper analysis of the daily chart reveals this pullback as a bearish reversal within the formation of a bull flag pattern.
Theoretically, this chart setup presents a long ascending trendline (pole) representing the prevailing bullish trend, followed by two downsloping trendlines that allow buyers to reignite the bullish momentum.
However, given that the broader trend remains bullish, the Bitcoin price is poised for a robust rebound. Successfully flipping the overhead resistance of $108,000 into potential support will signal the completion of the pattern, further supporting the continuation of the bullish trend.
As the broader trend remains bullish, market watchers are optimistic about a strong rebound.