 at a Critical Juncture: Is a 30% Drop on the Horizon?")
XLM’s Price Analysis: A Crucial Moment in Market Dynamics
XLM, the native token of the Stellar network and recognized as a formidable competitor to XRP, finds itself at a pivotal junction in its price journey. Recent developments illustrate that XLM may be on the verge of a significant price decline, largely influenced by bearish patterns emerging in the market. As traders and investors keep a close eye on price movements, it becomes imperative to delve into the technical analysis and the current momentum that may dictate XLM’s trajectory in the coming days.
XLM Technical Analysis and Upcoming Levels
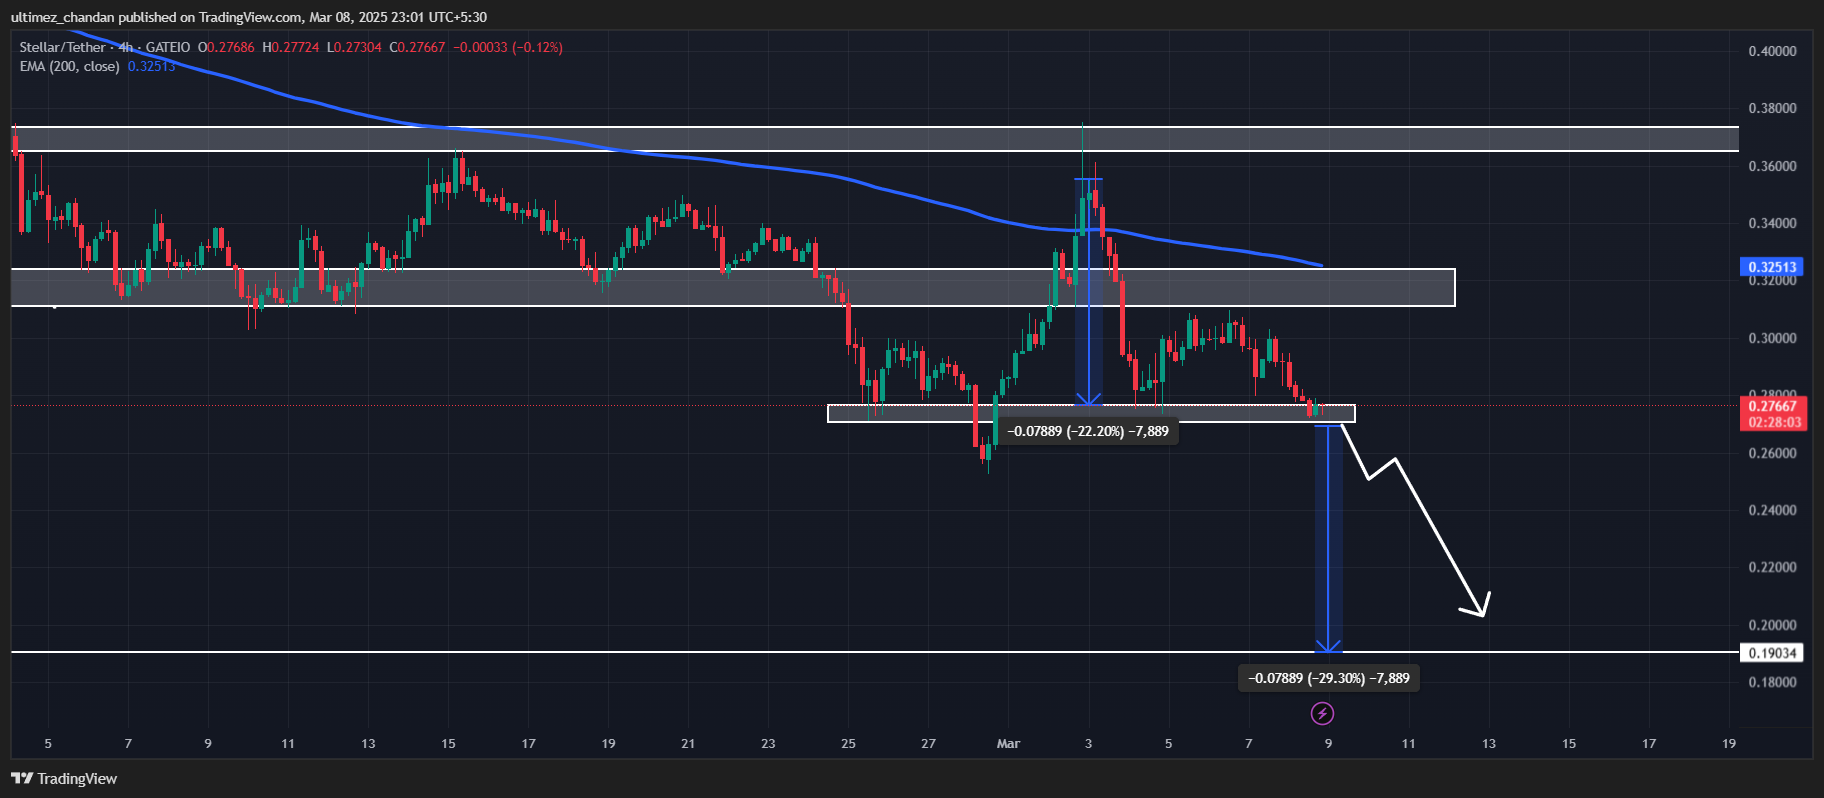
Technical analysts have observed that XLM has formed a bearish head and shoulders pattern, a classic indicator of potential price reversals that often signifies a downward trend. At this moment, XLM is precariously positioned just above the neckline of this bearish formation, creating a sense of urgency for traders. Should the asset succumb to downward pressure and close a four-hour candle below $0.265, the implications are grave; a decline of nearly 30% could see prices dipping to about $0.19.
The accompanying chart from TradingView highlights the significance of this pattern, underscoring the potential volatility that lies ahead. Such technical indicators are viewed with caution by traders mindful of past trends and the current market climate.
Current Price Momentum
Currently, XLM trades at approximately $0.275, reflecting a noticeable decline of over 4.5% in the past 24 hours. This downturn is more pronounced given the overall bearish sentiment saturating the market. A critical observation is the staggering 35% drop in trading volume during the same period, suggesting a waning interest from traders and investors alike. This combination of price decrease and reduced trading activity raises concerns about future price stability, particularly as market participants grapple with uncertainty.
Traders’ Over-Leveraged Positions
The current market landscape is complicated further by the side effects of over-leveraged trading positions among investors. According to the on-chain analytics firm Coinglass, traders are heavily positioned with long leverage, which could exacerbate the downward momentum if liquidation occurs. Specifically, there are approximately $500,000 in long positions concentrated at the $0.27 mark and around $2 million at $0.285. Such high levels of leverage can amplify price movements, particularly in a declining market, suggesting that fear could lead to a rush for the exits if XLM’s price falters further.

As can be seen, bears seem to hold the upper hand, with the current market structure heavily favoring a potential decline. The proximity of these leveraged positions could create a cascading effect, leading to broader selling pressure and further contributions to a bearish trend.
Market Sentiment and Broader Implications
The combination of these technical factors, current price actions, and trader behaviors creates a compelling narrative surrounding XLM’s short-term future. Market sentiment often plays a significant role in price dynamics; with so many traders placing leveraged bets in favor of a price increase, any shift in momentum could have dramatic effects, particularly if stop-loss orders are triggered.
As XLM hovers near crucial support levels and technical indicators signal potential breakdowns, both seasoned investors and newcomers will likely be watching developments closely. The ongoing struggle between buyers and sellers will define the next chapter for XLM, which continues to navigate the complexities inherent in a rapidly evolving crypto market. Keep an eye on the $0.265 mark, as crossing below this threshold could mark a significant turning point for XLM in the days to come.