
Bitcoin Cash’s Price Rallies Over 7% on Strong Support and Bullish On-Chain Metrics
Bitcoin Cash (BCH), one of the notable forks of Bitcoin, witnessed an impressive rally on Wednesday, soaring more than 7% to trade around $342. This upswing comes after the coin successfully retested its key support level the previous day, indicating robust market sentiment and potential for further gains.
Strong On-Chain Metrics Signal Bullish Prospects
Analyzing the on-chain metrics provides a clearer picture of what’s driving these price movements. Notably, BCH’s transaction rate has reached an all-time high of 3.6, as reported by Bitcoin Cash Explorer. This surge in transaction activity suggests an increase in traders’ interest and liquidity, pointing to greater user engagement within the BCH blockchain ecosystem. A rising transaction rate often correlates with improved network usage and can act as a precursor to price appreciation.
BCH Tx rate chart. Source: Bitcoin Cash Explorer
In addition to transaction metrics, there has been a notable increase in Bitcoin Cash’s open interest (OI) in cryptocurrency futures. Data from Coinglass indicates that the OI surged from $174.48 million on Sunday to $238.48 million on Wednesday. This is the highest level observed since early February and suggests that new capital is entering the BCH market. Increased open interest typically signals heightened investor activity and optimism, which could be a precursor to a further rally in BCH’s price.
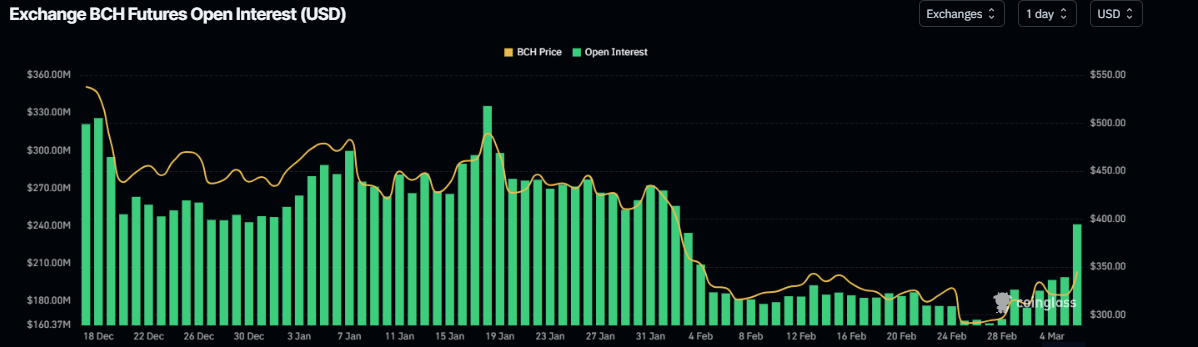
BCH open interest chart. Source: Coinglass
Technical Indicators Point to a Rally Targeting $390.5
The technical outlook for Bitcoin Cash also reinforces the bullish narrative. The price recently found solid support within the range of $279.2 to $299.7, and after bouncing off this range, BCH closed at $320.5. The current trading rate at about $342.4 represents a 7% increase, and if the support level is maintained, BCH could potentially rally nearly 13% further to reach its next resistance target at $390.5.
Furthermore, key technical indicators such as the Relative Strength Index (RSI) are revealing bullish signs. The RSI currently sits at 55—above the neutral level of 50 and trending upwards, indicating positive momentum. Additionally, the Moving Average Convergence Divergence (MACD) recently experienced a bullish crossover, which often signals the onset of a substantial upward trend in price.
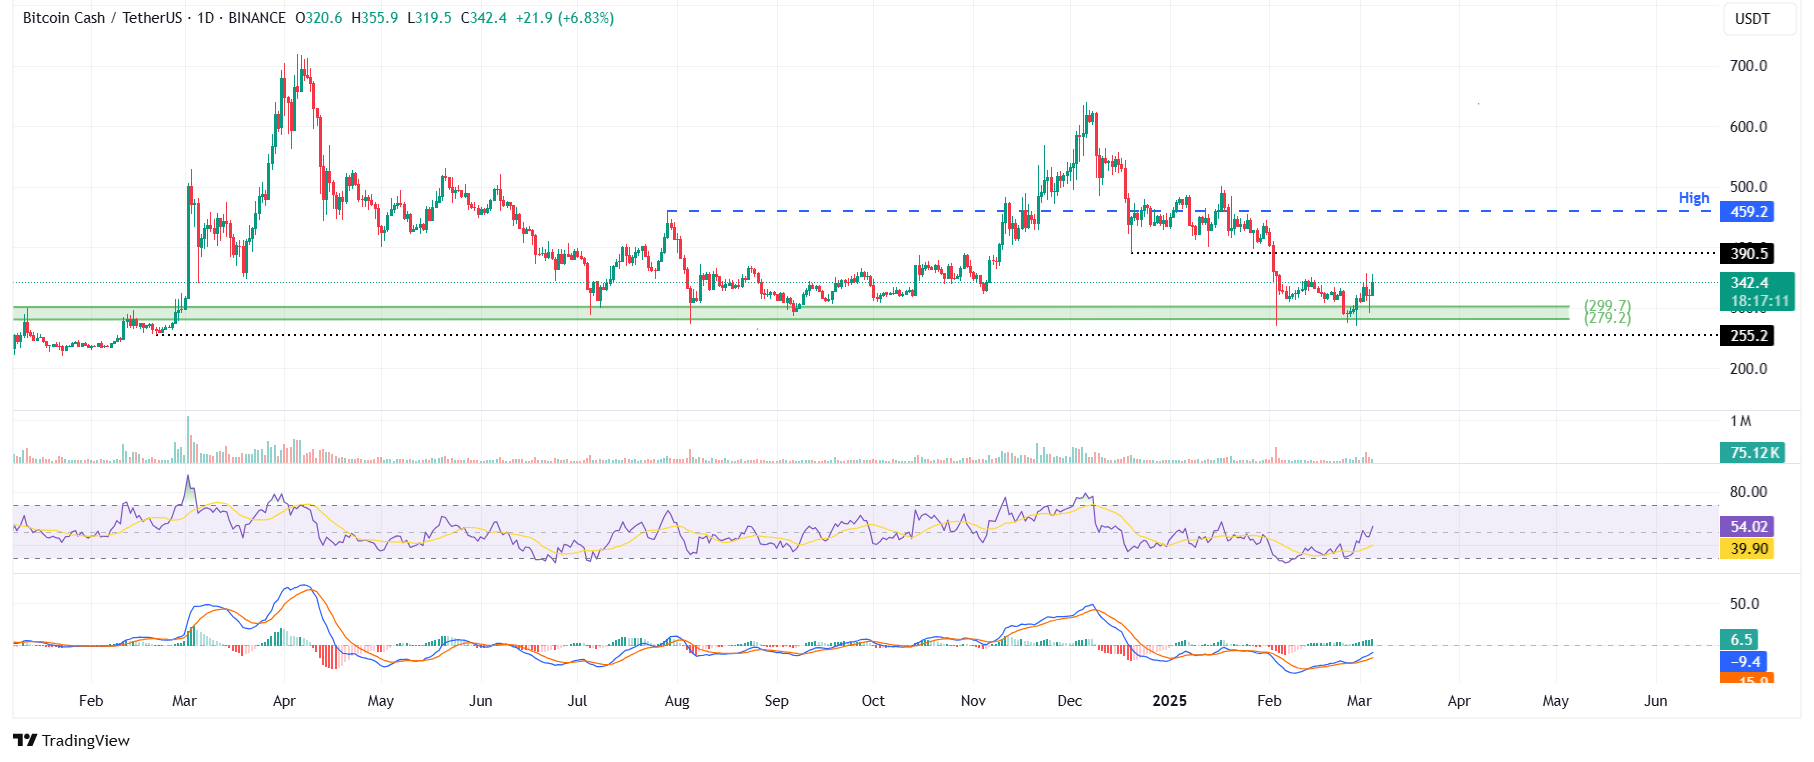
BCH/USDT daily chart
However, it’s important to consider potential risks. Should Bitcoin Cash close below the lower support threshold of $279.2, it could signal further decline, potentially revisiting the lows around $255.2 recorded on February 21, 2024. Thus, while the immediate technical and on-chain indicators appear favorable for BCH, vigilance remains crucial for traders and investors alike.