
After a period of consolidation around the $96,500 mark, Bitcoin has encountered significant selling pressure, pushing its price down to the support level of $89,000. Let’s delve into an analysis to better understand the technical outlook for BTC.

Bitcoin Price Situation (BTC)
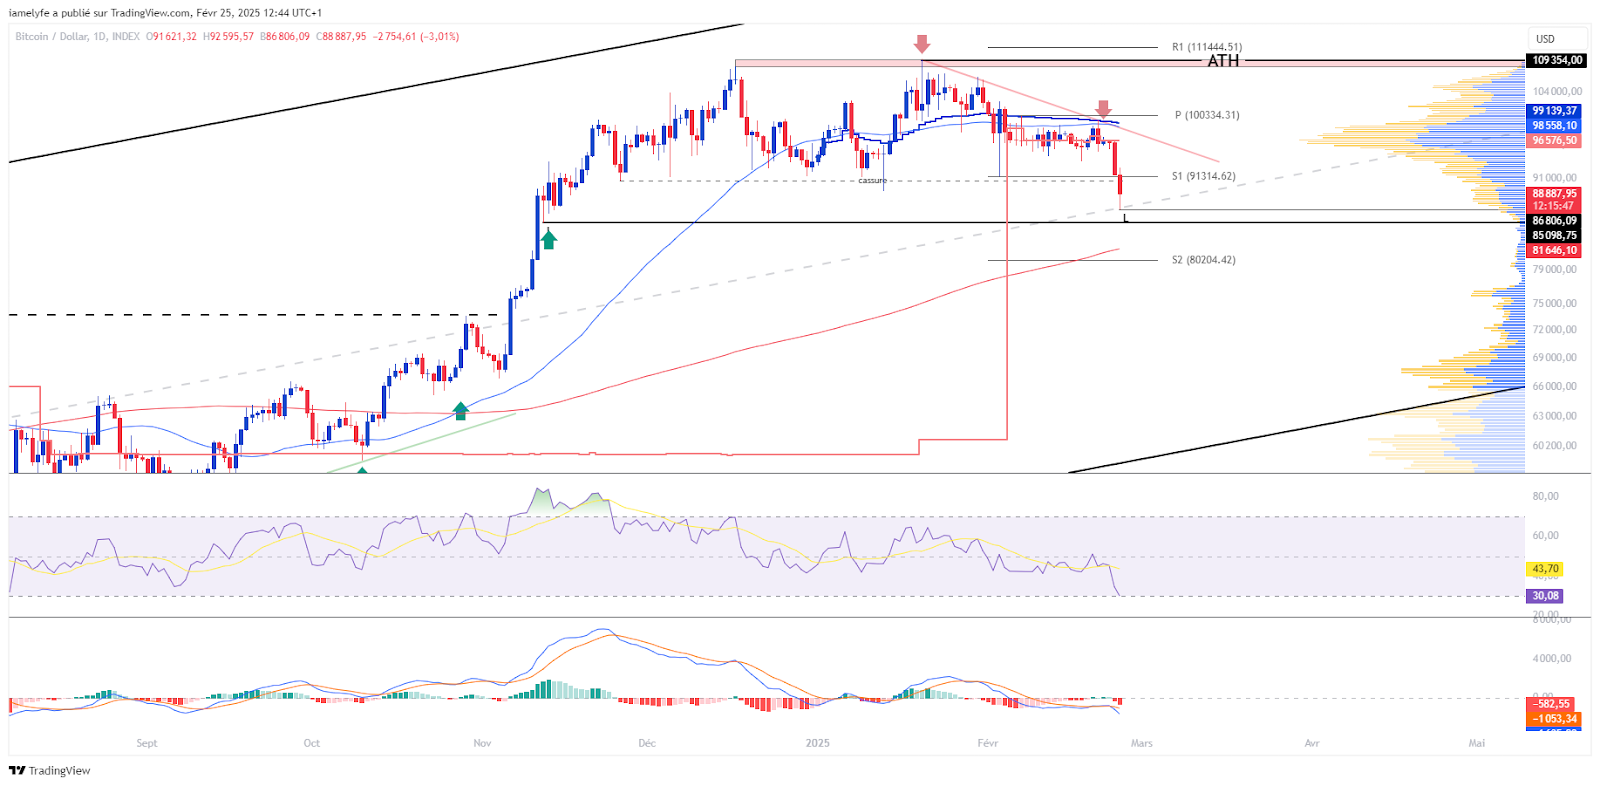
Bitcoin has been navigating through tumultuous waters recently. After a rebound attempt from $91,350, it experienced a consolidation phase between $93,450 and $99,150. Unfortunately for bulls, this level was breached from below, affirming the bearish outlook predicted in our earlier February 19 analysis. Consequently, Bitcoin recorded approximately a 10% drop, plummeting beneath the first monthly pivot support to reach the support zone identified around $89,000, falling below the lower end of the range established since late 2024.
As of this moment, Bitcoin trades around $88,000, having dipped to $86,900—marking its lowest point since its recent all-time high (ATH). This bearish trend is further emphasized as the price rests below significant value areas, underscored by the annual VWAP and the 50-day moving average—both suggesting a distinctly bearish short-term momentum.
Long-term prospects for Bitcoin remain bullish. However, the medium-term trajectory has turned neutral and may soon confirm a reversal, especially if existing declines continue to gain momentum.
The waning bullish momentum is visibly illustrated in both Bitcoin’s price decline and its oscillators, which have recently hit new lows.
This technical analysis has been curated in partnership with Elyfe, a seasoned investor and cryptocurrency market expert.
Focus on Derivatives (BTC/USDT)
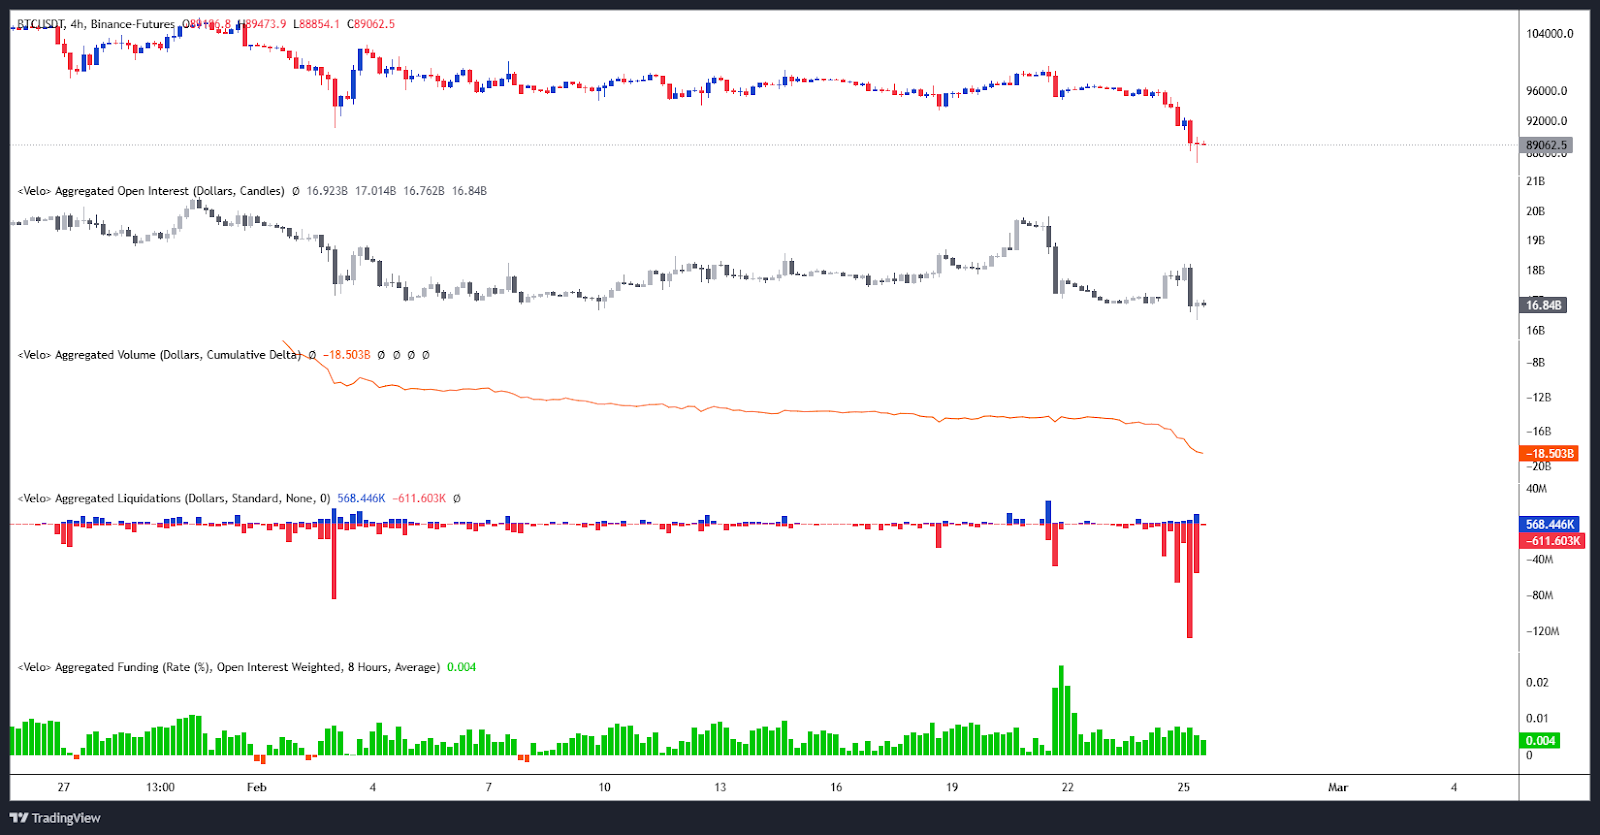
Over the past few weeks, there has been a noticeable stabilization in both open interest and the underlying price of Bitcoin, signaling a phase of market consolidation. However, with Bitcoin’s recent bearish downturn, we have seen a concurrent decline in open interest, indicative of a gradual withdrawal of positions in BTC/USDT perpetual contracts.
The recent plunge in the cumulative volume delta (CVD) has rapidly worsened, revealing a prevailing dominance of sell orders currently saturating the market. This trend underscores a resurgence of seller aggressiveness and a palpable inclination to sell from investors.
Bitcoin’s downturn has triggered the largest spate of long position liquidations since the start of 2025, amounting to nearly $331 million liquidated within just two days. This wave of liquidations not only reflects intense selling pressure but also amplifies market volatility, diminishing overall buying strength. Yet, despite this bearish sentiment, the funding rate for BTC/USDT contracts has remained slightly positive, indicating some resilience among buyers despite ongoing selling activity.
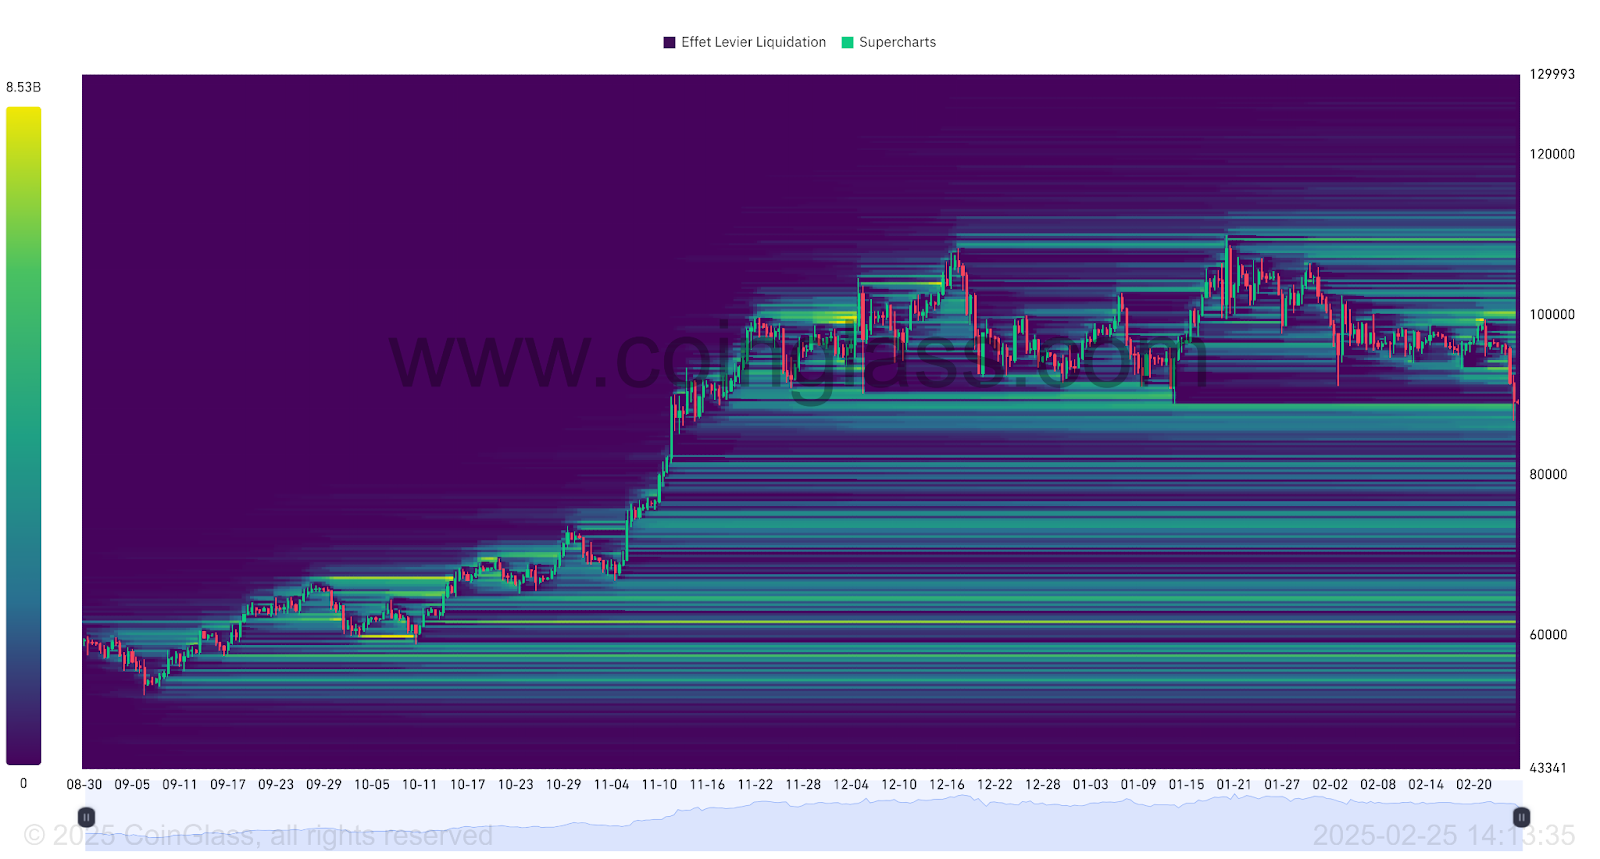
A visual representation of the perpetual BTC/USDT contract liquidations heatmap shows that Bitcoin has ventured into a significant liquidation zone around the $88,000 mark. A flicker of buying interest seems to have emerged, as indicated by a sudden price rebound upon hitting this level.
Current liquidation zones of considerable interest hover on both sides of the present price:
- On the upside, the first liquidation zone is detected between $97,000 and $98,000, followed by a larger zone around $100,000, extending up to $104,000. Even higher, another zone exists between $107,000 to $111,000.
- Conversely, on the downside, the liquidation zone extends up to $84,500. Further down, another zone lies around $80,000, with a more pronounced zone appearing towards $74,000.
These price thresholds signify major inflection points for the market; therefore, movements toward these levels could instigate substantial order reactions, playing a crucial role in upcoming market dynamics based on the supply-demand equilibrium.
Bitcoin Price Forecasts (BTC)
- Should Bitcoin sustain its position above $86,800, a recovery is possible that could allow it to regain $90,700, potentially paving the way toward resistance at $99,400. Surpassing this threshold might facilitate a move back to $106,000, followed by its ATH of $109,354, which would mean an increase of approximately 22%.
- On the other hand, if Bitcoin fails to maintain above $86,800, it could find support at around $85,000. A sustained decline may then drag its price to $81,700, or even $78,500. Breaking this level could signal a further decline toward the $76,000 zone, representing a potential decrease of about 15%.
Continuing our exploration of Bitcoin’s price action and market dynamics reveals an intricate interplay between bullish and bearish forces, necessitating close attention to key support and resistance levels.
Maximize your Cointribune experience with our “Read to Earn” program! For every article you read, earn points and access exclusive rewards. Sign up now and start earning benefits.