
The Bitcoin price narrowly escaped a deeper breakdown this week, bouncing 2.1% in the past 24 hours to trade near $103,700 after briefly falling to around $98,900. The move stabilized sentiment, but the market isn’t in the clear yet.
To confirm a true recovery, Bitcoin would need to climb another 12% from current levels — a move that would finally shift the structure from caution to confidence and invalidate the ongoing bearish setup.
Sponsored
Bearish Crossover Builds as Money Flow Remains Weak
On the daily chart, Bitcoin faces pressure from a potential bearish crossover forming between the 20-day and 200-day Exponential Moving Averages (EMAs). EMAs smooth out price data to highlight trend direction, and when a shorter EMA drops below a longer one, it often signals that buyers are losing strength.
A similar 50-day/100-day crossover on November 4 triggered a sharp 10% price dip, underlining the risk of another leg down if this crossover completes.
At the same time, the Chaikin Money Flow (CMF) — which tracks whether capital is entering or leaving the market — continues to hover below zero. CMF has been negative since late October and remains trapped under a downtrend line drawn from October 4.
Want more token insights like this? Sign up for Editor Harsh Notariya’s Daily Crypto Newsletter here.
Until CMF breaks above that line and sustains a positive reading, it signals that large wallets are still holding back and that real inflows haven’t yet returned. Together, the weakening EMAs and negative money flow explain why the rebound feels fragile despite short-term strength.
Sponsored
Hodlers Still Unconvinced After the Post-Crash BTC Bounce
Even after Bitcoin’s rebound, long-term holders haven’t started accumulating again. The Hodler Net Position Change, which measures whether older wallets are buying or selling, remains deep in the red.
Between November 2 and November 5, the metric dropped from –43,810 BTC to –52,250 BTC, a decline of 19.2%. That means long-term investors sold an additional 8,400 BTC during the recovery — showing that conviction is still missing.
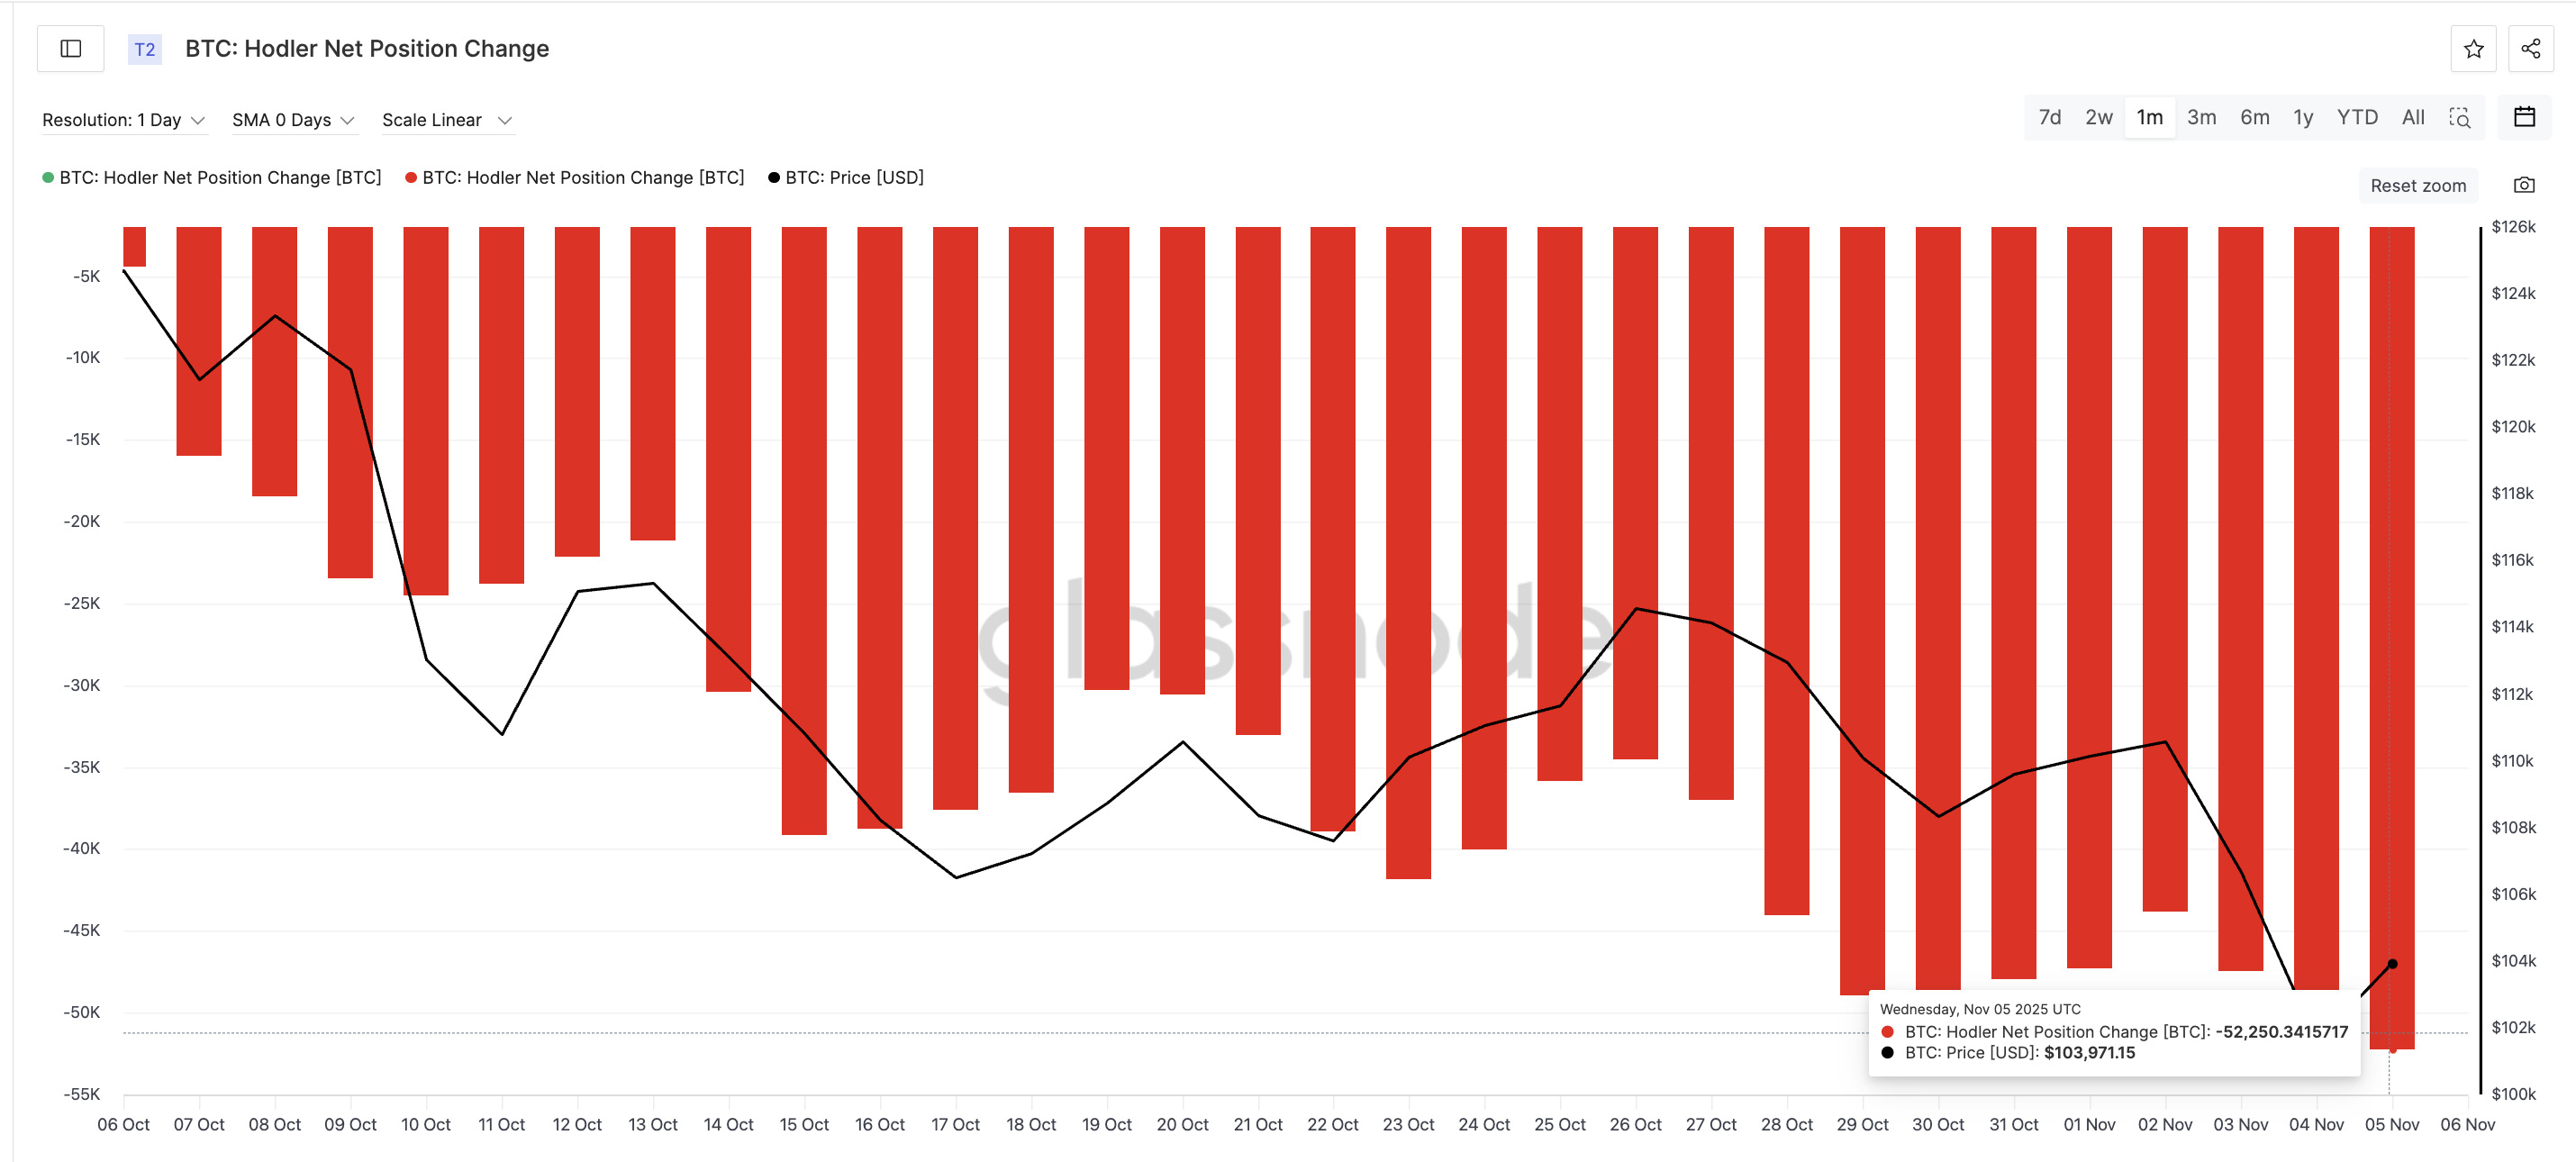
Historically, meaningful recoveries have only taken hold once hodlers start adding to their stacks. Their ongoing selling indicates that faith in this rebound remains weak and that traders are driving most of the move.
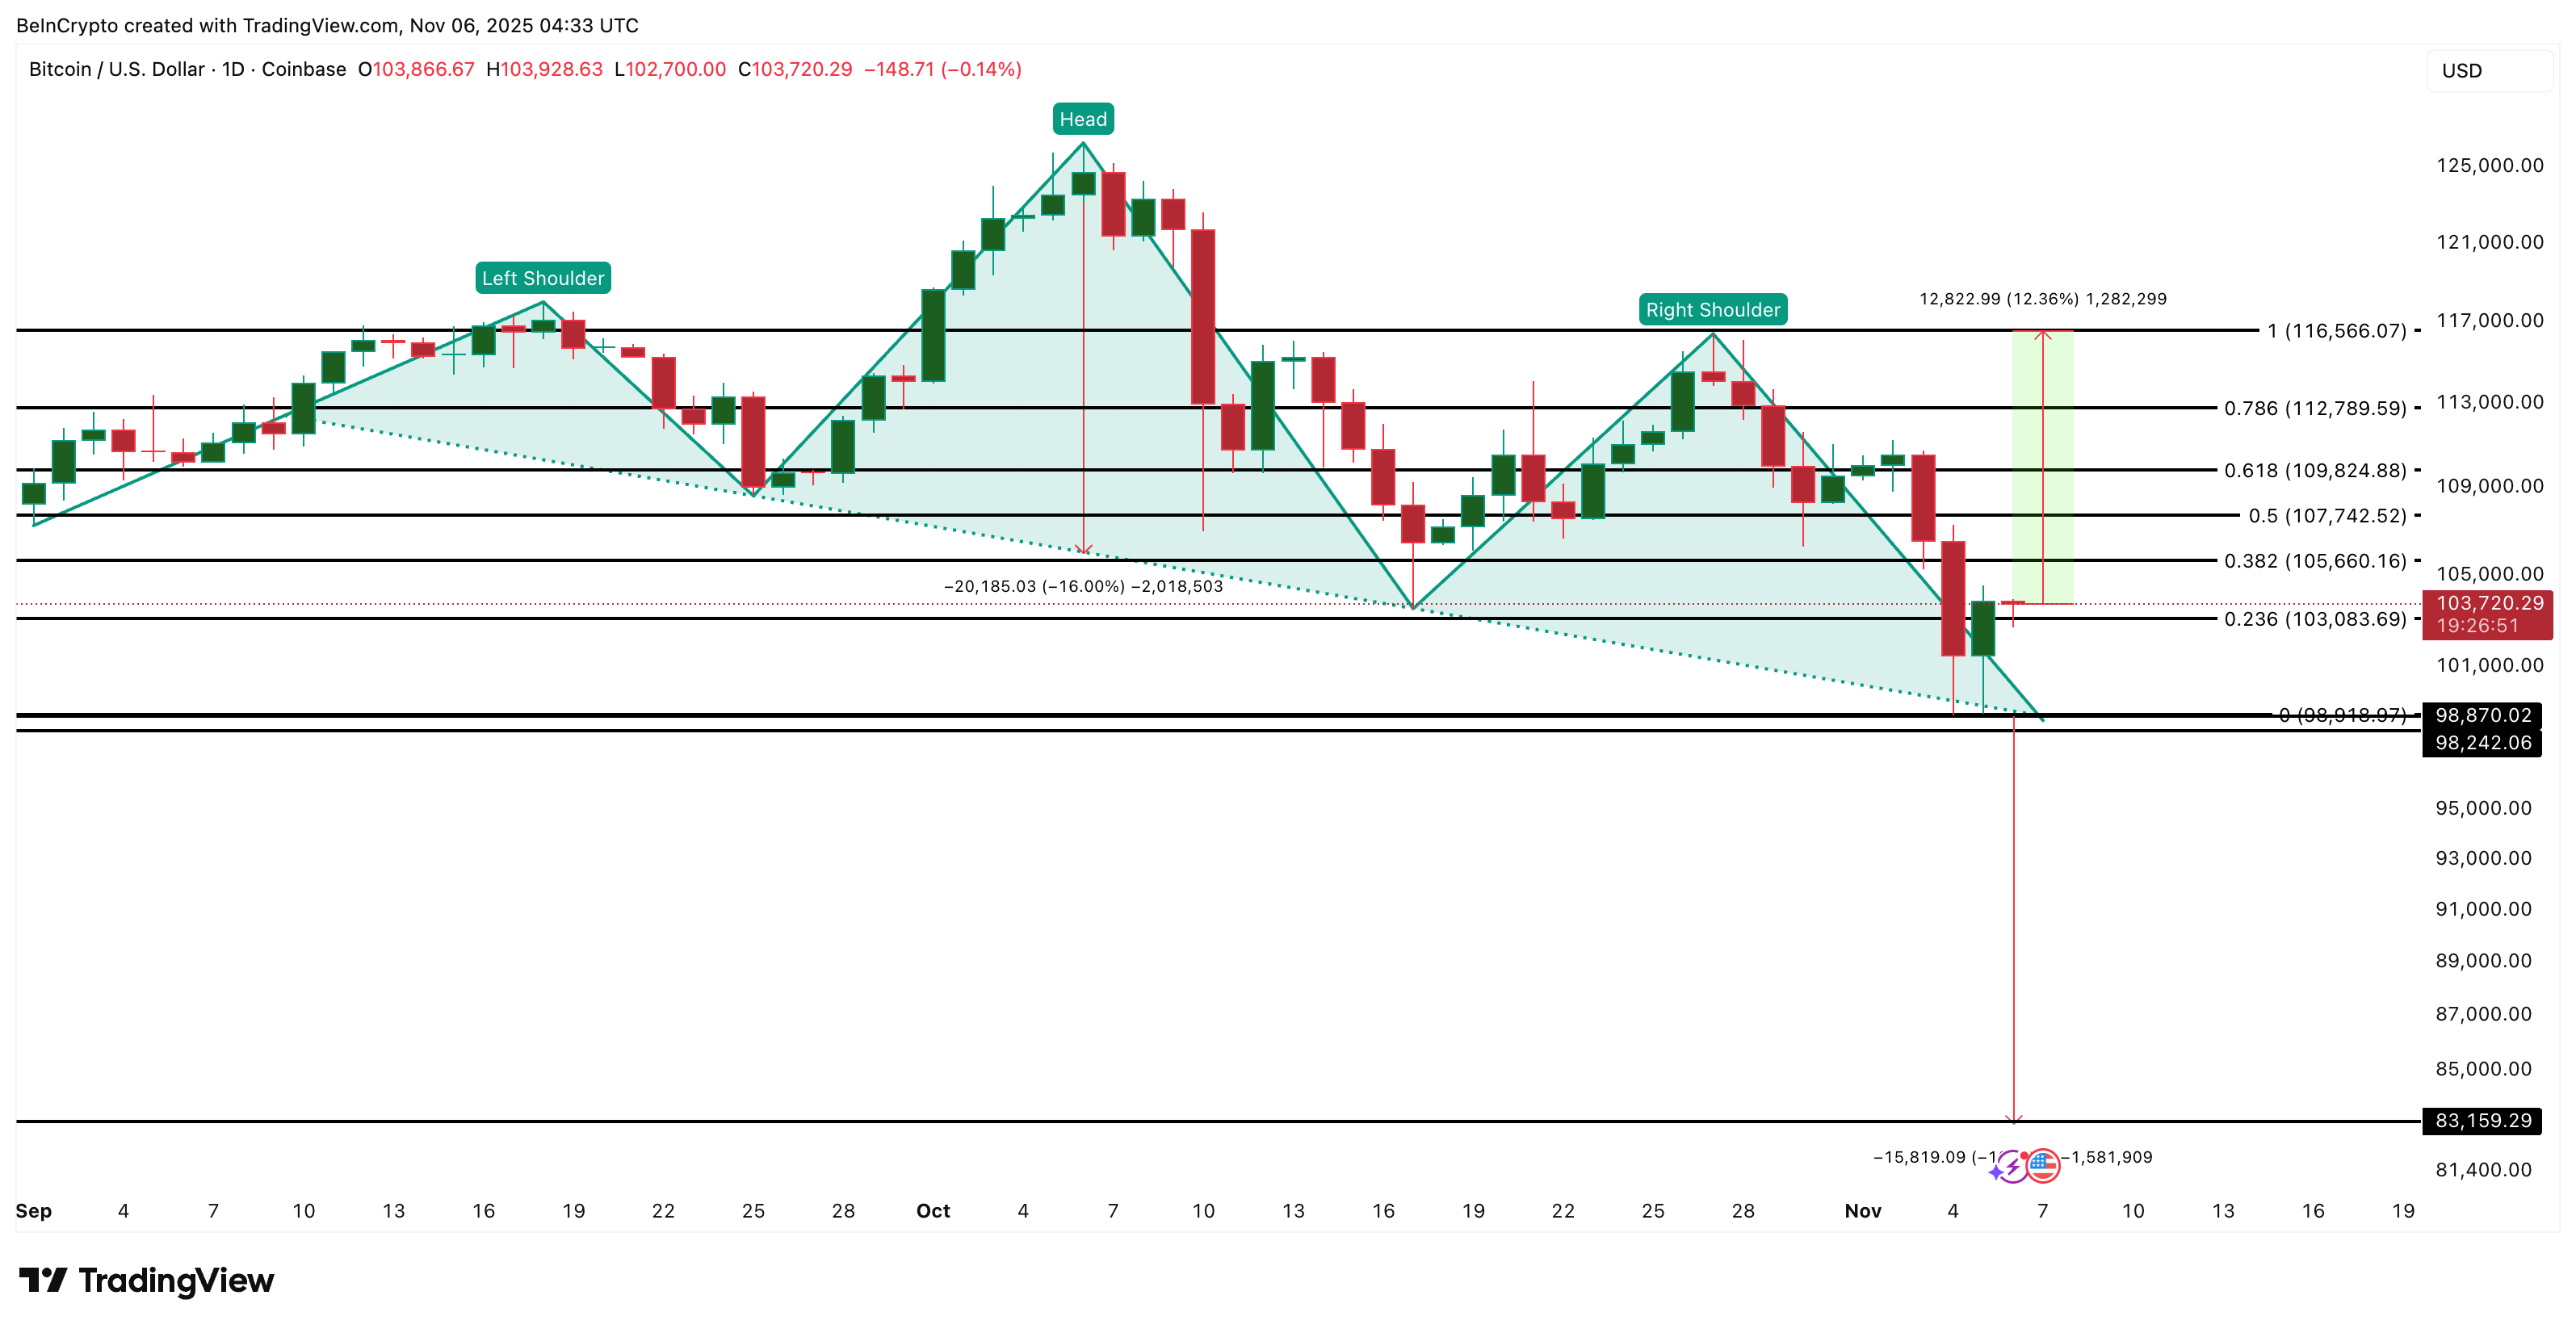
For the Bitcoin price to shift bullish again, it must hold above $103,000 and reclaim $105,600 in the short term. The key confirmation level lies at $116,500, roughly 12% above current prices. A break above it would invalidate the head and shoulders pattern and confirm a stronger recovery phase.
However, if $103,000 fails, Bitcoin risks revisiting $98,900. A daily close under that would trigger a neckline breakdown. And that could push the BTC price toward $83,100, the pattern’s projected downside target.
For now, Bitcoin has avoided disaster. But the lack of strong inflows, weak hodler activity, and looming bearish crossover suggest that this rebound remains fragile. Until the price gains 12% and reclaims higher ground, Bitcoin may have escaped the fall, but it’s far from safe.