
Bitcoin (BTC) spent most of October moving sideways, gaining barely 1.5% across the month. Over the past week, though, the Bitcoin price has climbed nearly 5%, bringing the focus back to a possible bullish reversal.
Earlier this week, Bitcoin briefly crossed $113,200 before getting rejected near $115,000—a zone that now defines the line between hesitation and renewed strength. The rejection looked sudden, but the data shows it was expected. If one key level gives way, the recovery could be too.
Why The Breakout Failed
The initial signal came from on-chain behavior rather than traditional price charts. CryptoQuant’s Spent Output Value Bands, which track how much Bitcoin each holder group transfers to exchanges, indicated a sharp rise in selling pressure between October 25 and 28. Notably, the 100–1,000 BTC group (often referred to as “sharks”) increased their exchange transfers from 1,046 BTC to 7,191 BTC. Meanwhile, the 1,000–10,000 BTC group (or “whales”) added around 3,250 BTC during the same period.
Such inflows often indicate profit-taking or short-term hedging. Combined, these activities flooded exchanges with supply just as Bitcoin tested the critical $115,000 level, capping the price movement and halting what could have been a smoother continuation of upward momentum.
This wave of large-holder selling actions explains why the breakout attempt stalled despite strong retail optimism.
Why The Setup Still Holds
Even after the sell pressure, Bitcoin’s foundation remains sturdy. Glassnode’s Holder Accumulation Ratio (HAR), which tracks how many wallets are adding to their BTC balance, still stands firm at 60.2%. Any figure above 50% signifies net accumulation, suggesting long-term holders are quietly buying. While it’s slightly below the recent three-month high of near 63%, the data confirms that the broader buying trend is intact.
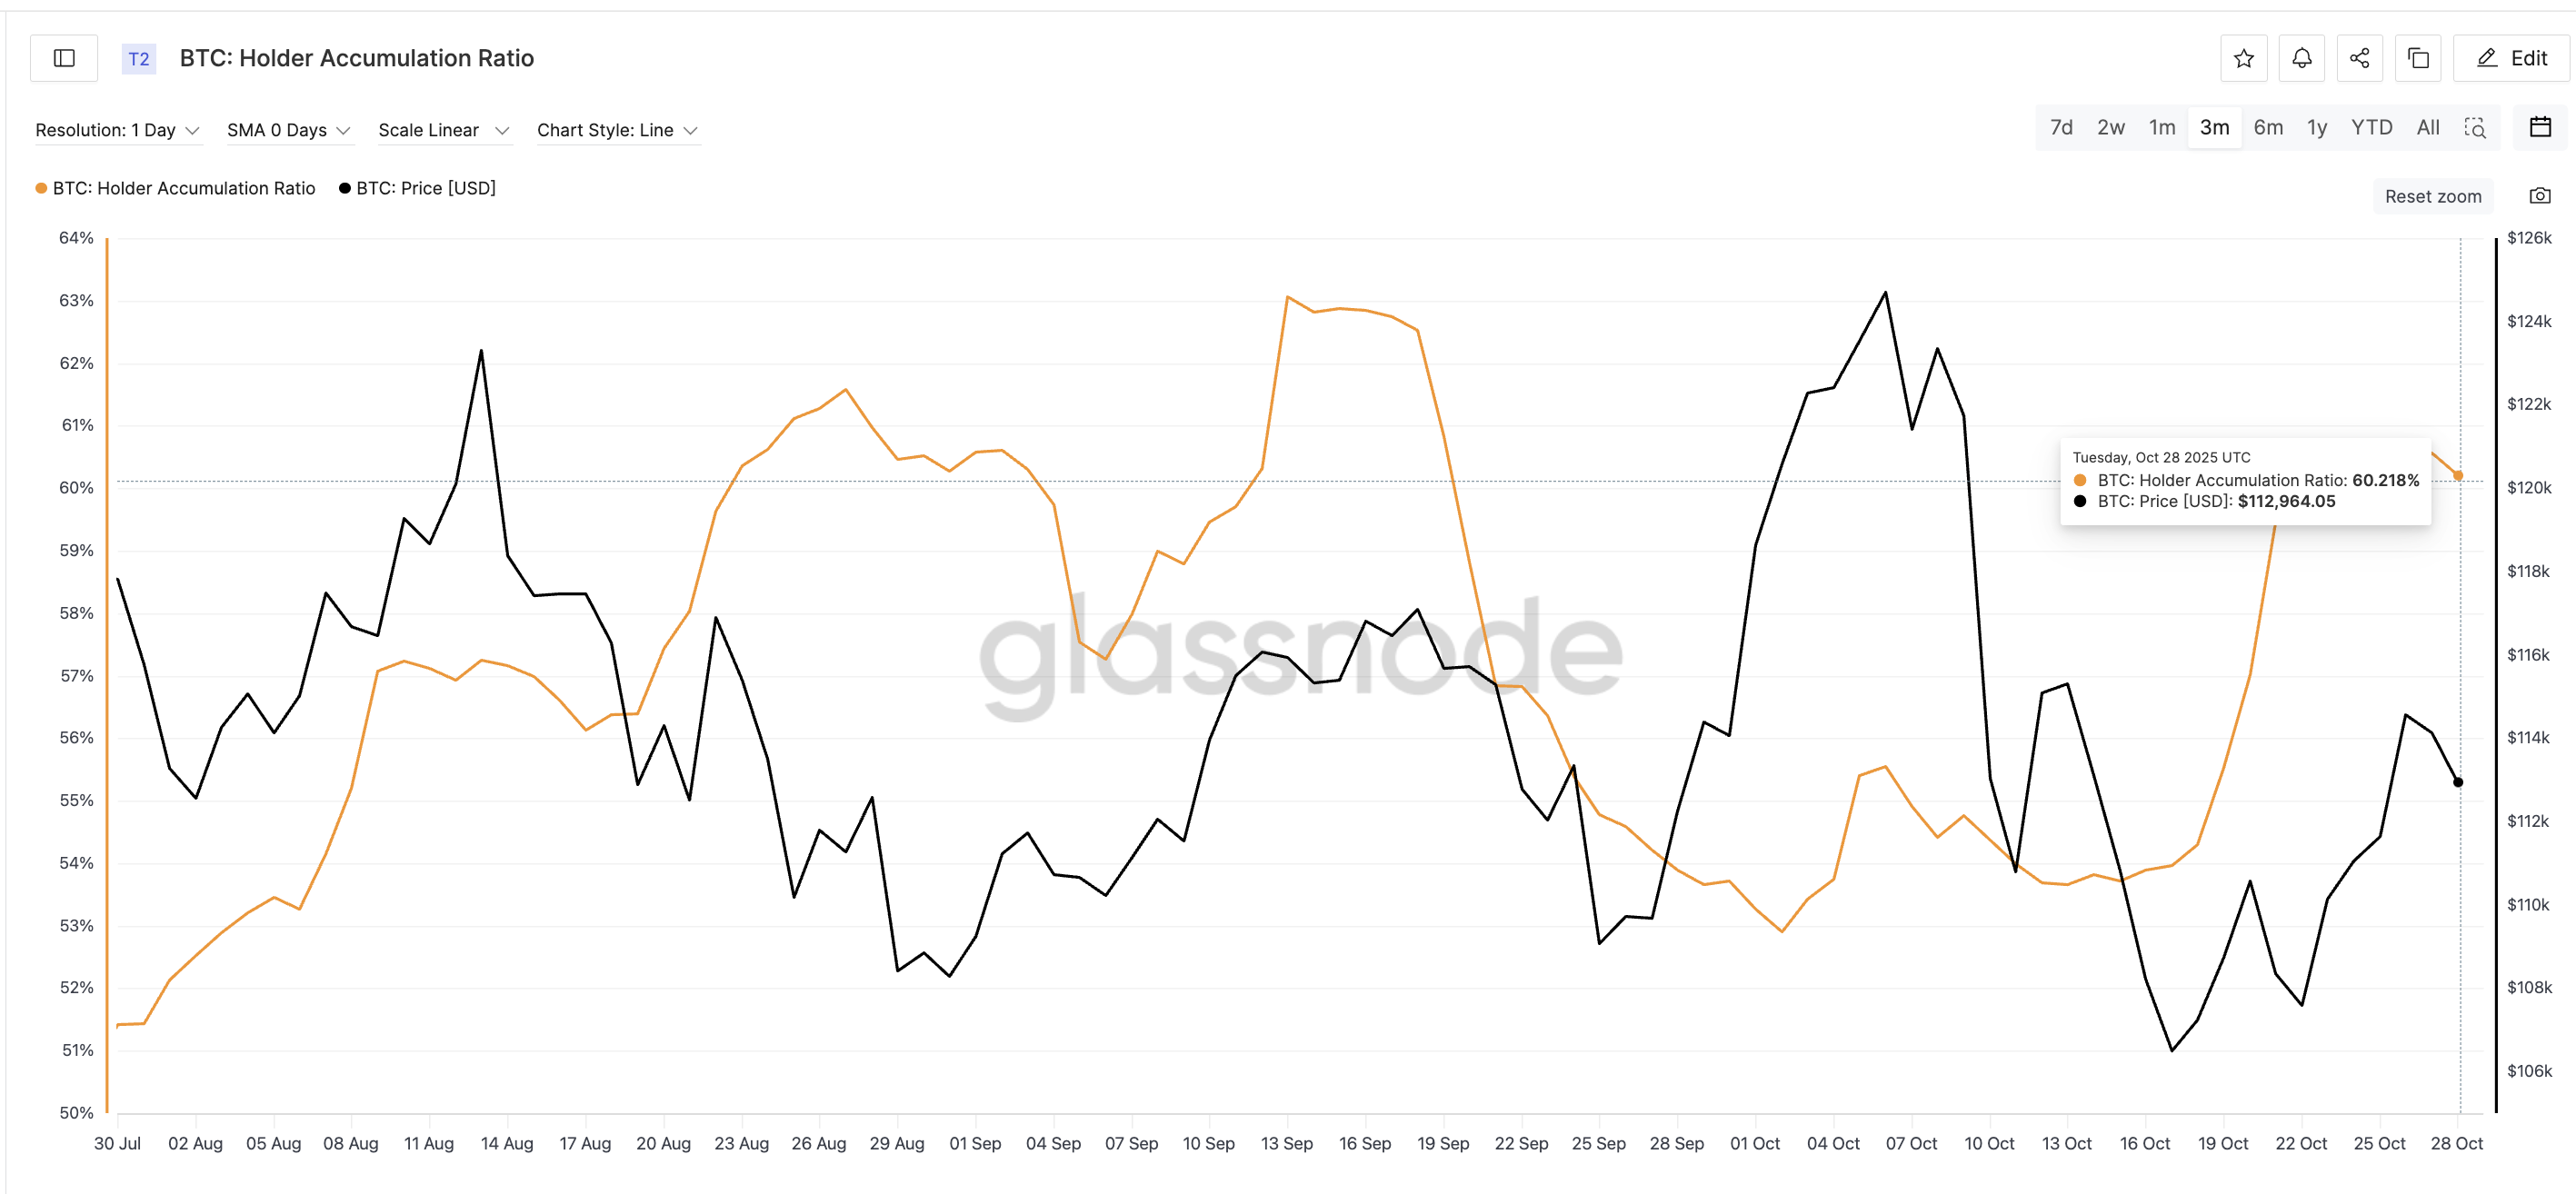
This behavior is crucial because it offsets the short-term selling pressure from whales. As long-term holders absorb the coins moving to exchanges, it prevents deeper pullbacks and maintains stability in the market. This ongoing absorption keeps the door open for a renewed push if momentum picks up again.
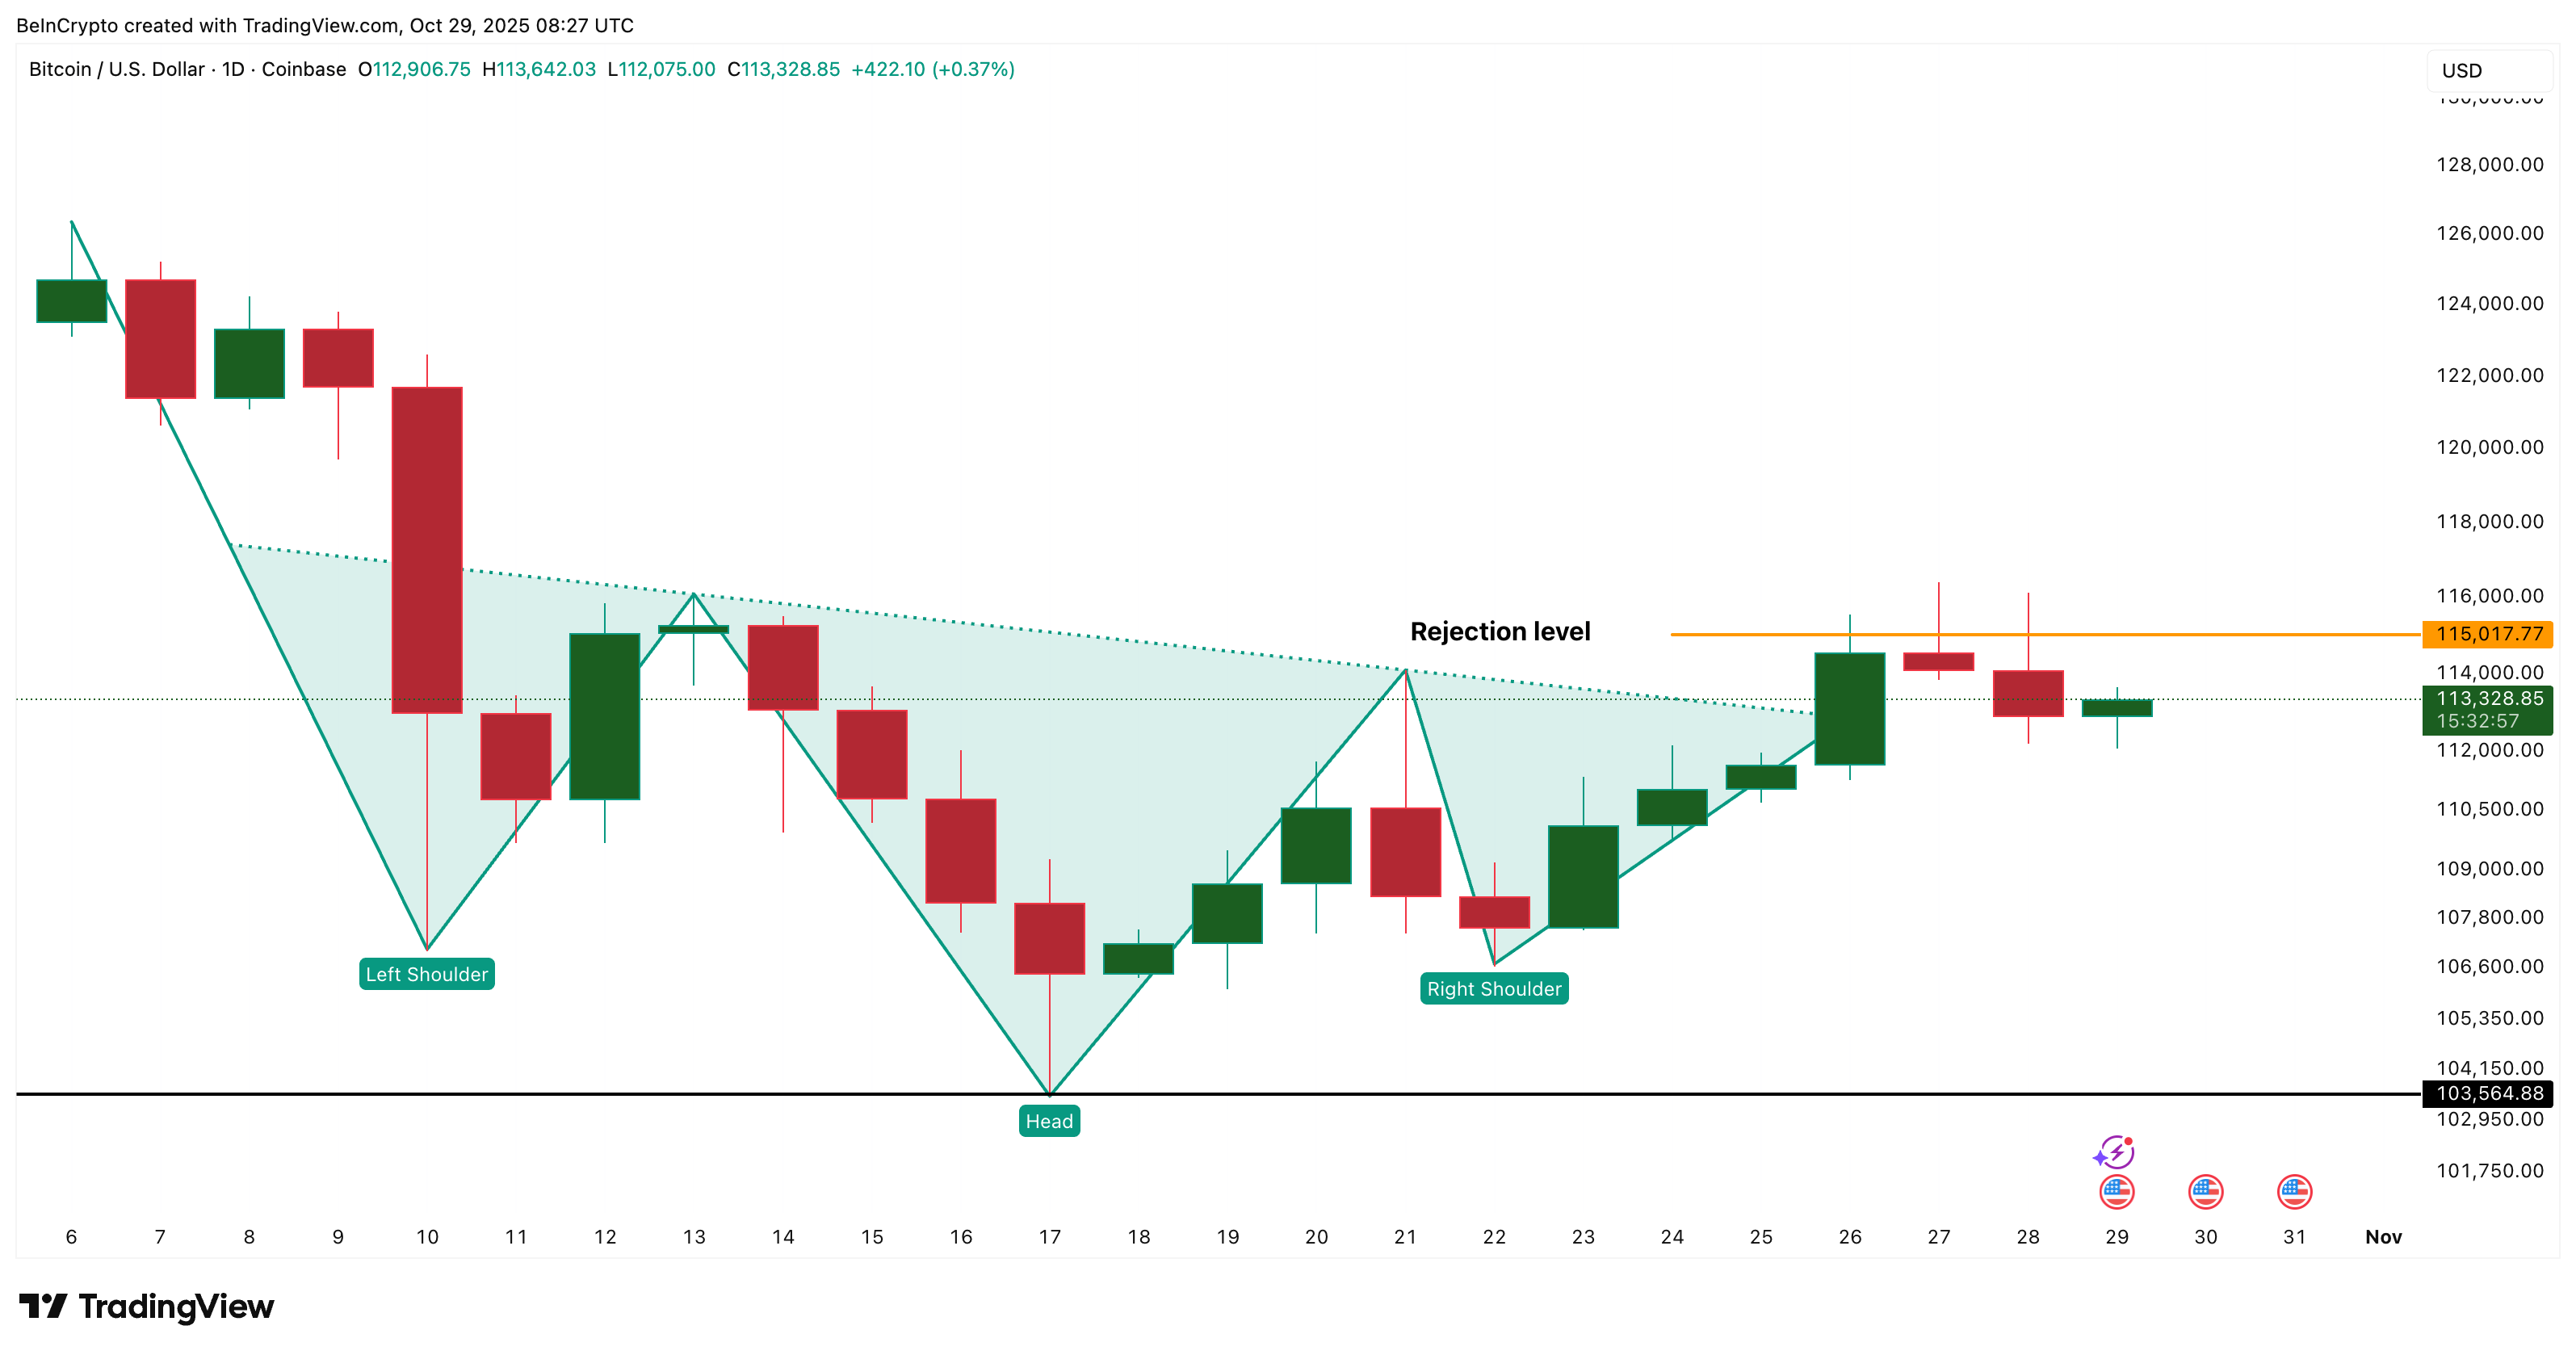
Bitcoin Price Structure And Why The Recovery Is Expected
Bitcoin’s current technical setup follows a clear structure, resembling an inverse head and shoulders pattern that typically signifies a shift from selling to buying momentum. This formation remains valid as long as BTC holds above $106,600, which acts as the base of this pattern.
The Relative Strength Index (RSI), a popular indicator used to measure the strength of buying or selling momentum, first signaled a hidden bearish divergence between October 13 and 26, coinciding with the attempted breakout. During that time, Bitcoin’s price made a lower high, while the RSI made a higher high—indicating that momentum was weakening even as the price was pushed up.
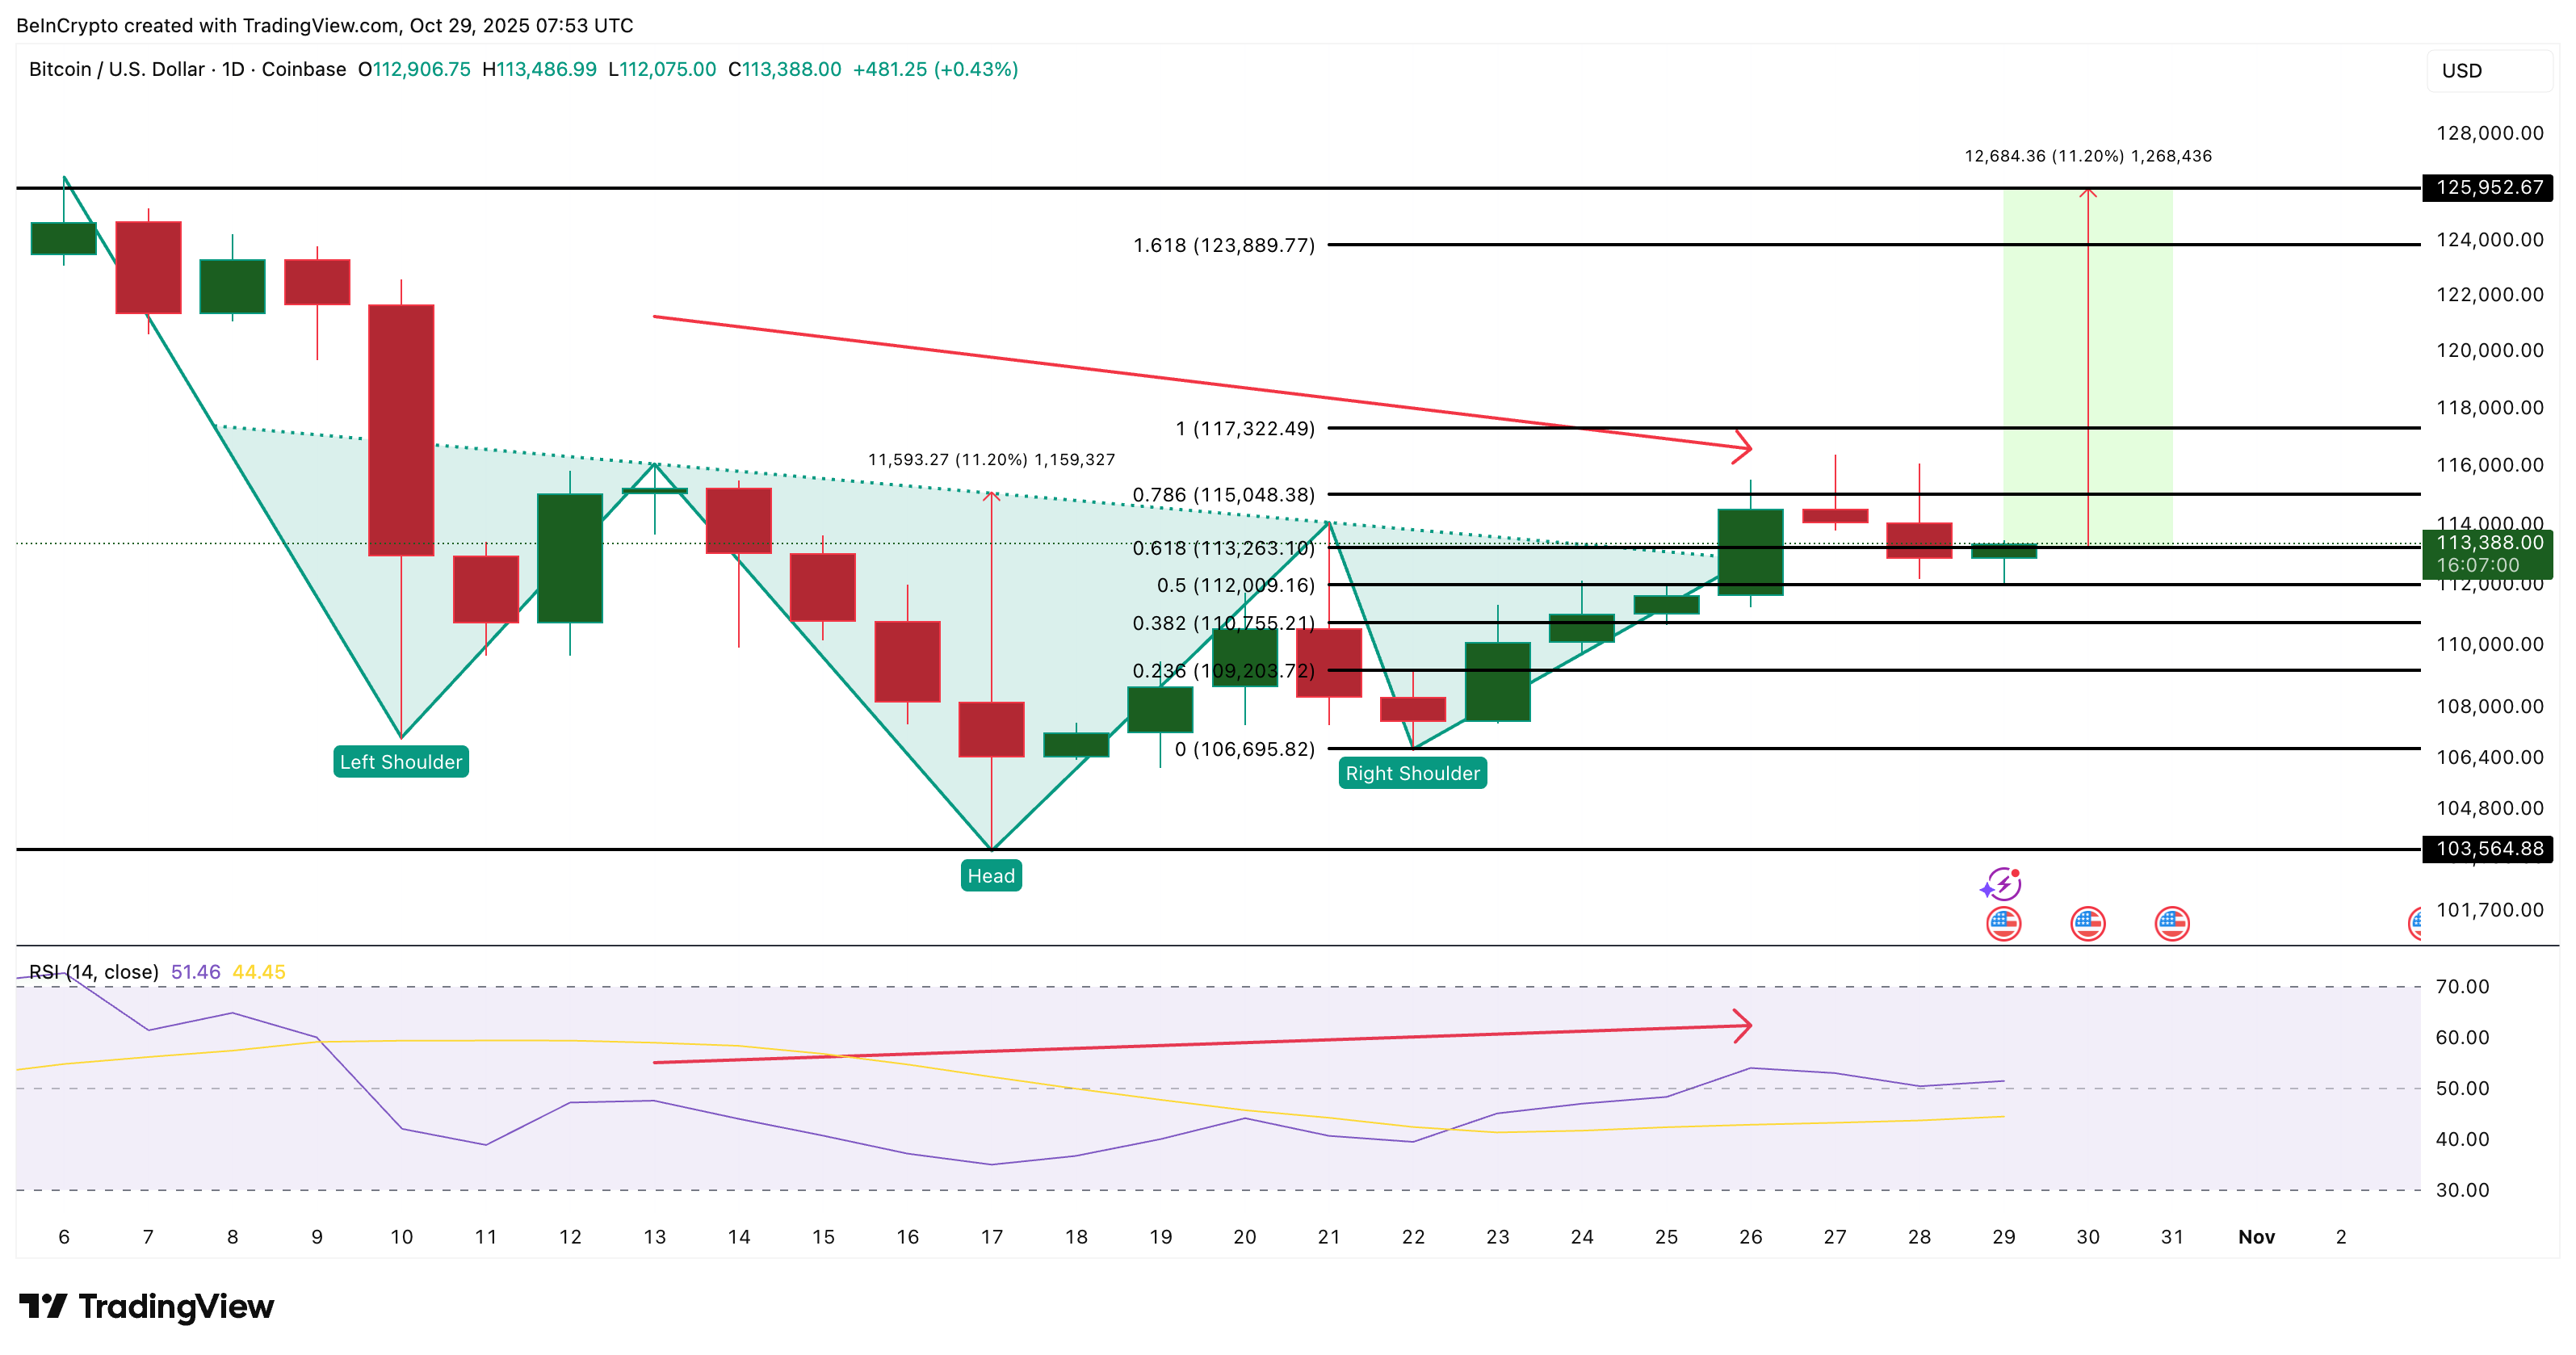
This imbalance led many traders to expect a potential breakout failure near $115,000, which ultimately transpired with the subsequent rejection and short-term correction.
Currently, the divergence has flattened, indicating that the RSI and the Bitcoin price are moving in sync again. This stabilization reveals that sellers are losing their grip, and the environment for recovery is accumulating strength. However, the crucial test remains at $115,000. This level not only capped the last breakout attempt but will also determine whether the bullish pattern continues to evolve higher.
If Bitcoin can close decisively above this level, the neckline breakout could pave the way toward further targets at $117,300 and $125,900 (near BTC’s historical peaks), which would represent an 11% gain from its current range. Conversely, if BTC fails to hold and dips below $106,600, it could invalidate the bullish setup and even push the price down toward $103,500.